Volatility is a crucial concept that every investor needs to know, as it measures the degree of variation in the price of a security over time. Understanding and managing volatility is essential to minimize risk and optimize portfolios.
Volatility, as measured by the VIX (Volatility Index), can provide insights into market sentiment. Changes in volatility can serve as warning signs for potential trend reversals in individual stocks as well. Indicators, like the Average True Range (ATR) and Wilder’s Volatility Stop Loss, can help identify significant changes in volatility that may signal a shift a change in trend and help limit portfolio losses.
VIX: A Barometer of Market Fear
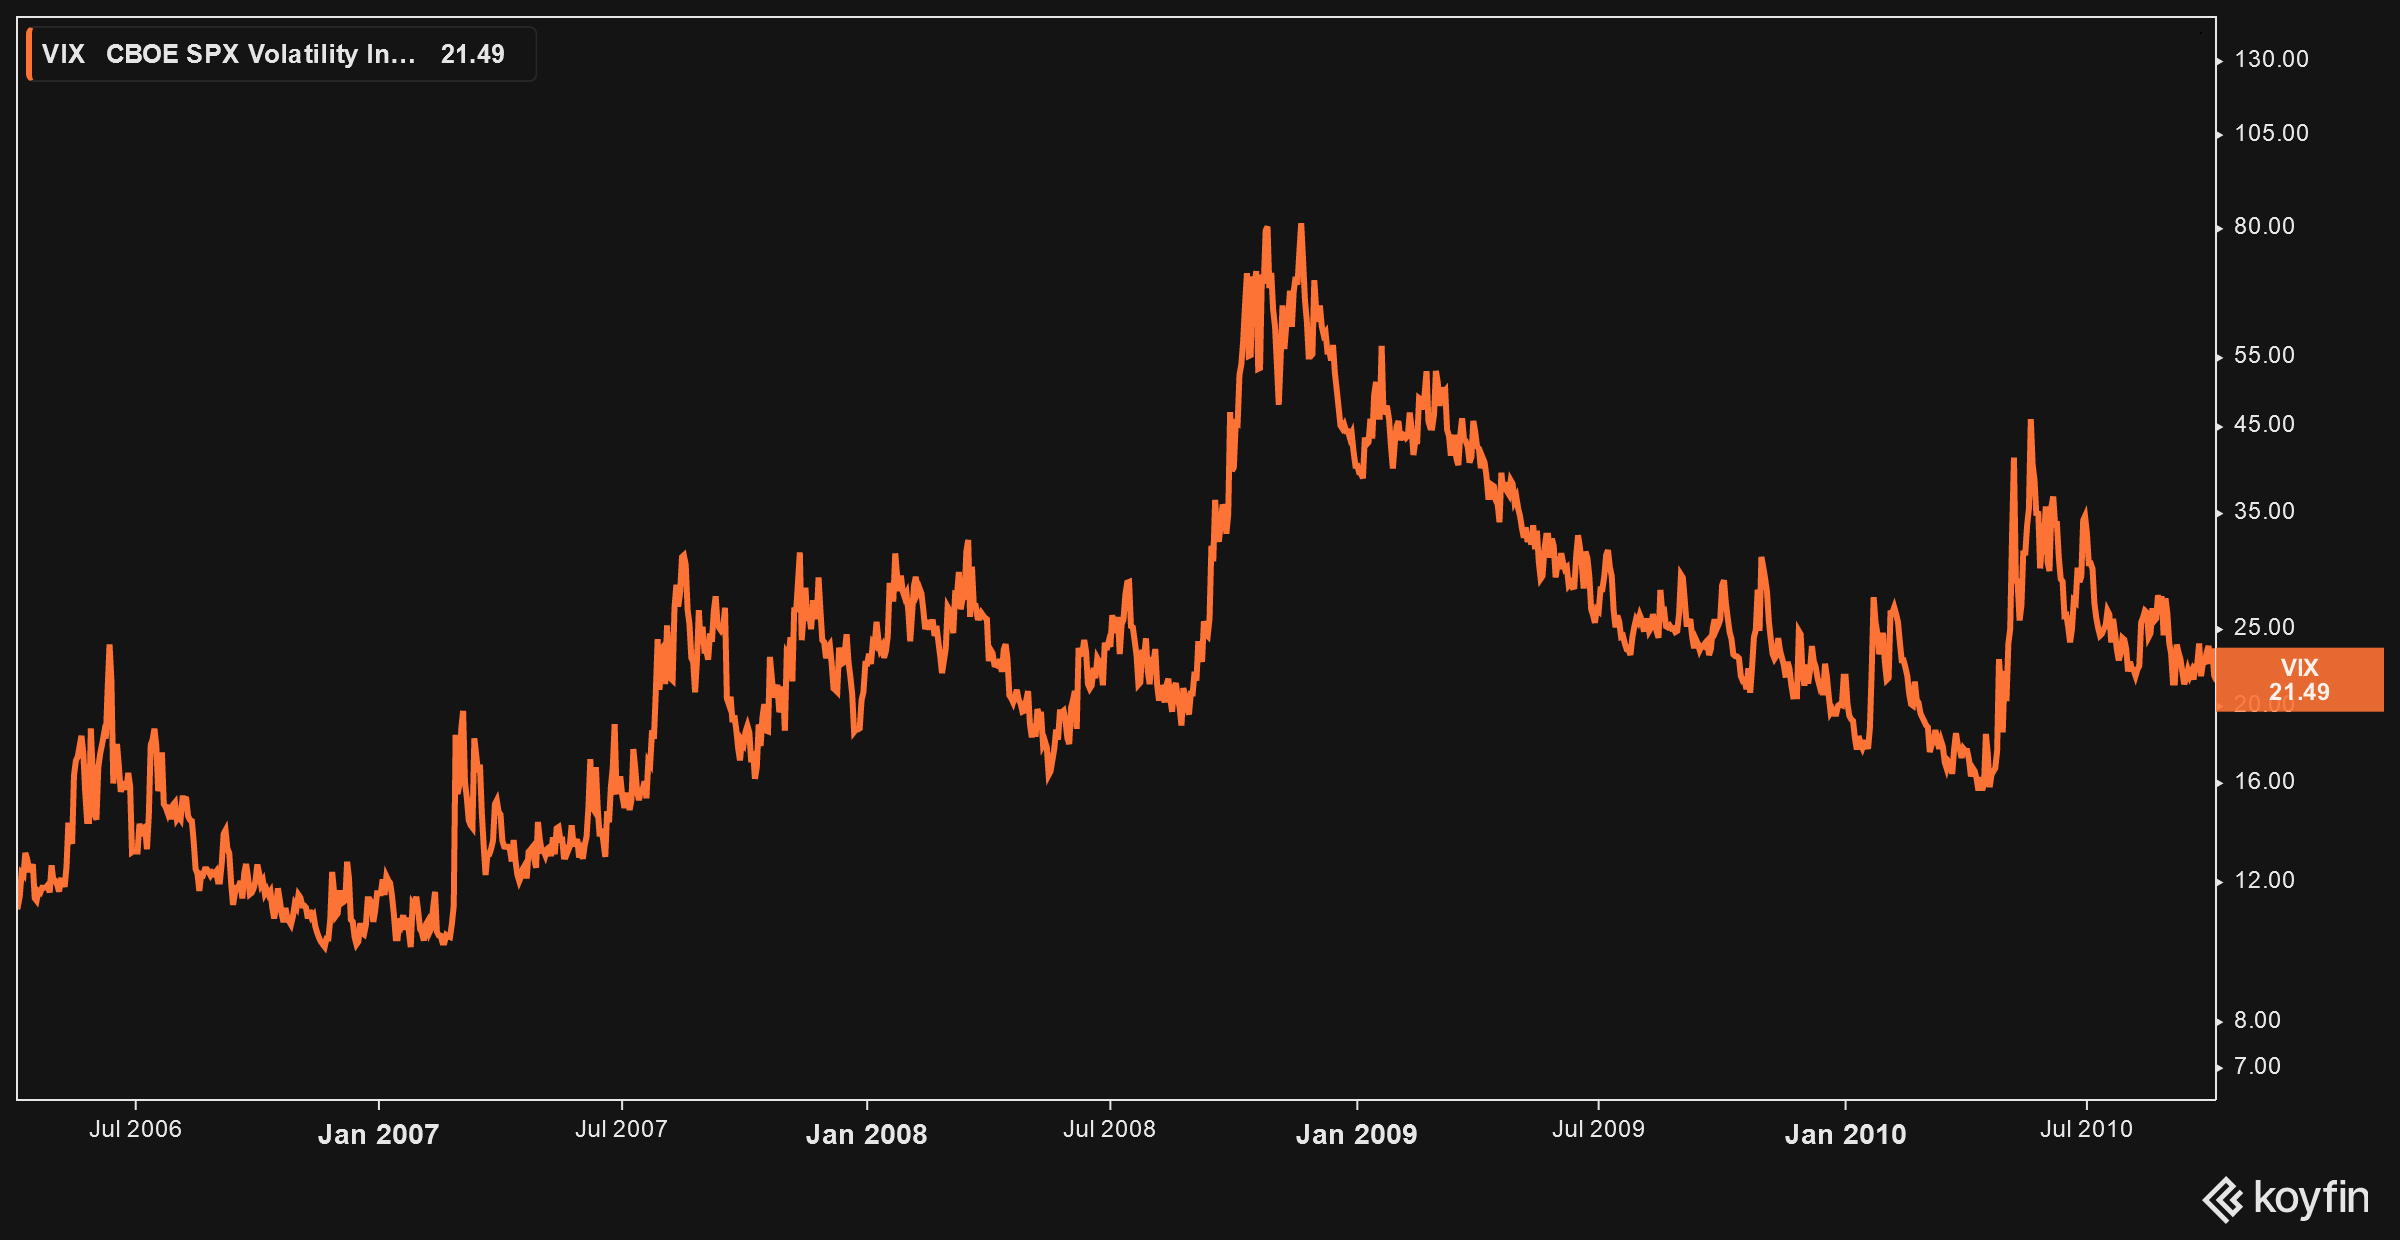
The VIX, often referred to as the “fear index,” is a widely used measure of market volatility. It is calculated based on the implied volatility of S&P 500 index options and provides a gauge of expected market volatility over the next 30 days.
When the VIX rises, it indicates increased fear and uncertainty among market participants, often coinciding with market downturns or periods of heightened risk aversion. During times of market stress, such as economic crises, geopolitical events, or unexpected news, the VIX tends to spike, reflecting the elevated levels of fear and uncertainty in the market.
For example, during the 2008 financial crisis, the VIX reached an all-time high of 89.53 on October 24, 2008, as investors grappled with the collapse of major financial institutions and the ensuing market turmoil.
Investors can use the VIX as a tool to assess the overall market sentiment and adjust their risk management strategies accordingly. When the VIX is rising, it may be prudent to adopt a more defensive approach, such as reducing exposure to risky assets or implementing hedging strategies to protect against potential market downturns.
Volatility as a Warning Sign for Trend Reversals
While the VIX provides a broad measure of market volatility, changes in volatility at the individual stock level can also offer valuable insights. A sudden increase in volatility can often precede a trend reversal, particularly when the stock has been in a prolonged upward trend.
One way to measure volatility at the stock level is through the use of the Average True Range (ATR) indicator. ATR measures the average range between the high and low prices of a stock over a specified period, typically 14 days.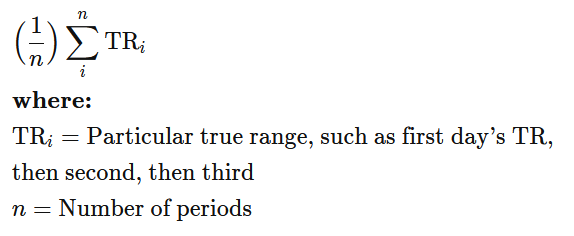
Source: Investopedia
A significant increase in ATR, such as a reading that is two to three times the standard deviation or greater, can indicate a heightened level of volatility and potentially signal an impending trend reversal.
For example, let’s consider the case of XYZ stock, which has been in a steady uptrend for several months. If the ATR suddenly spikes to a level that is three times its average value, it could be a warning sign that the upward momentum is losing steam and a reversal may be on the horizon. Investors holding XYZ stock may want to consider tightening their stop-loss orders or reducing their position size to manage risk in case of a potential trend reversal.
Another useful tool for identifying changes in volatility is Wilder’s Volatility Stop Loss. Developed by J. Welles Wilder, this indicator calculates a stop-loss level based on the ATR and a multiplier. When the stock price closes below the Wilder’s Volatility Stop Loss level, it suggests that the upward trend may be losing momentum and a reversal could be imminent.
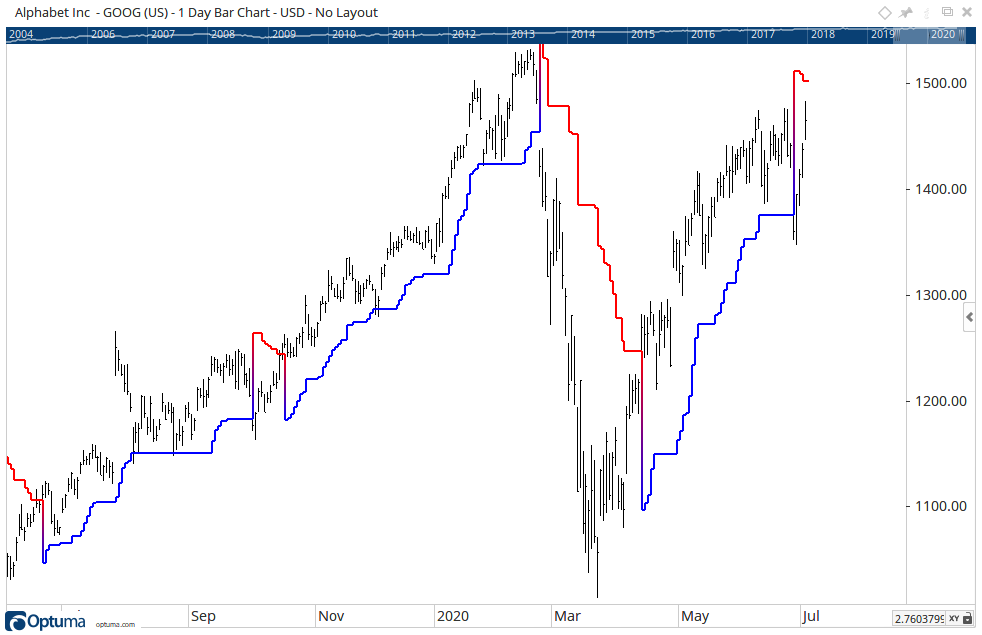
To illustrate the use of Wilder’s Volatility Stop Loss, let’s revisit the example of XYZ stock. Suppose the current price of XYZ is $100, and the ATR is $2. Using a multiplier of 3, the Wilder’s Volatility Stop Loss would be calculated as follows:
Wilder’s Volatility Stop Loss = Current Price – (ATR * Multiplier)
= $100 – ($2 * 3)
= $94
If XYZ stock closes below $94, it would trigger a sell signal based on Wilder’s Volatility Stop Loss, indicating that the upward trend may be coming to an end and it’s time to exit the position or implement risk management strategies.
Incorporating Volatility to Improve Risk Management Strategies
By monitoring changes in volatility, both at the market level through the VIX and at the individual stock level using indicators like ATR and Wilder’s Volatility Stop Loss, investors can enhance their risk management strategies. When volatility rises significantly, it may be prudent to take the following actions:
- Tighten Stop Losses: As volatility increases, the likelihood of sharp price movements also rises. By adjusting stop-loss levels based on volatility indicators, investors can limit their potential losses and protect their capital. For example, if the ATR of a stock doubles, investors may consider moving their stop-loss orders closer to the current price to account for the increased volatility.
- Reduce Position Sizes: During periods of heightened volatility, it may be wise to reduce the size of individual positions to mitigate the impact of potential price swings on the overall portfolio. By allocating a smaller portion of the portfolio to each position, investors can limit their exposure to any single stock that may experience significant volatility.
- Diversify Holdings: Spreading investments across different sectors, asset classes, and geographies can help reduce the overall portfolio volatility and minimize the impact of any single stock or sector experiencing increased volatility. By maintaining a well-diversified portfolio, investors can potentially offset losses in one area with gains in another, thereby reducing the overall risk.
- Consider Hedging Strategies: Implementing hedging strategies, such as buying put options or using inverse ETFs, can provide downside protection during volatile market conditions. These strategies can help mitigate losses in the event of a market downturn or a significant decline in individual stock prices.
Real-World Examples:
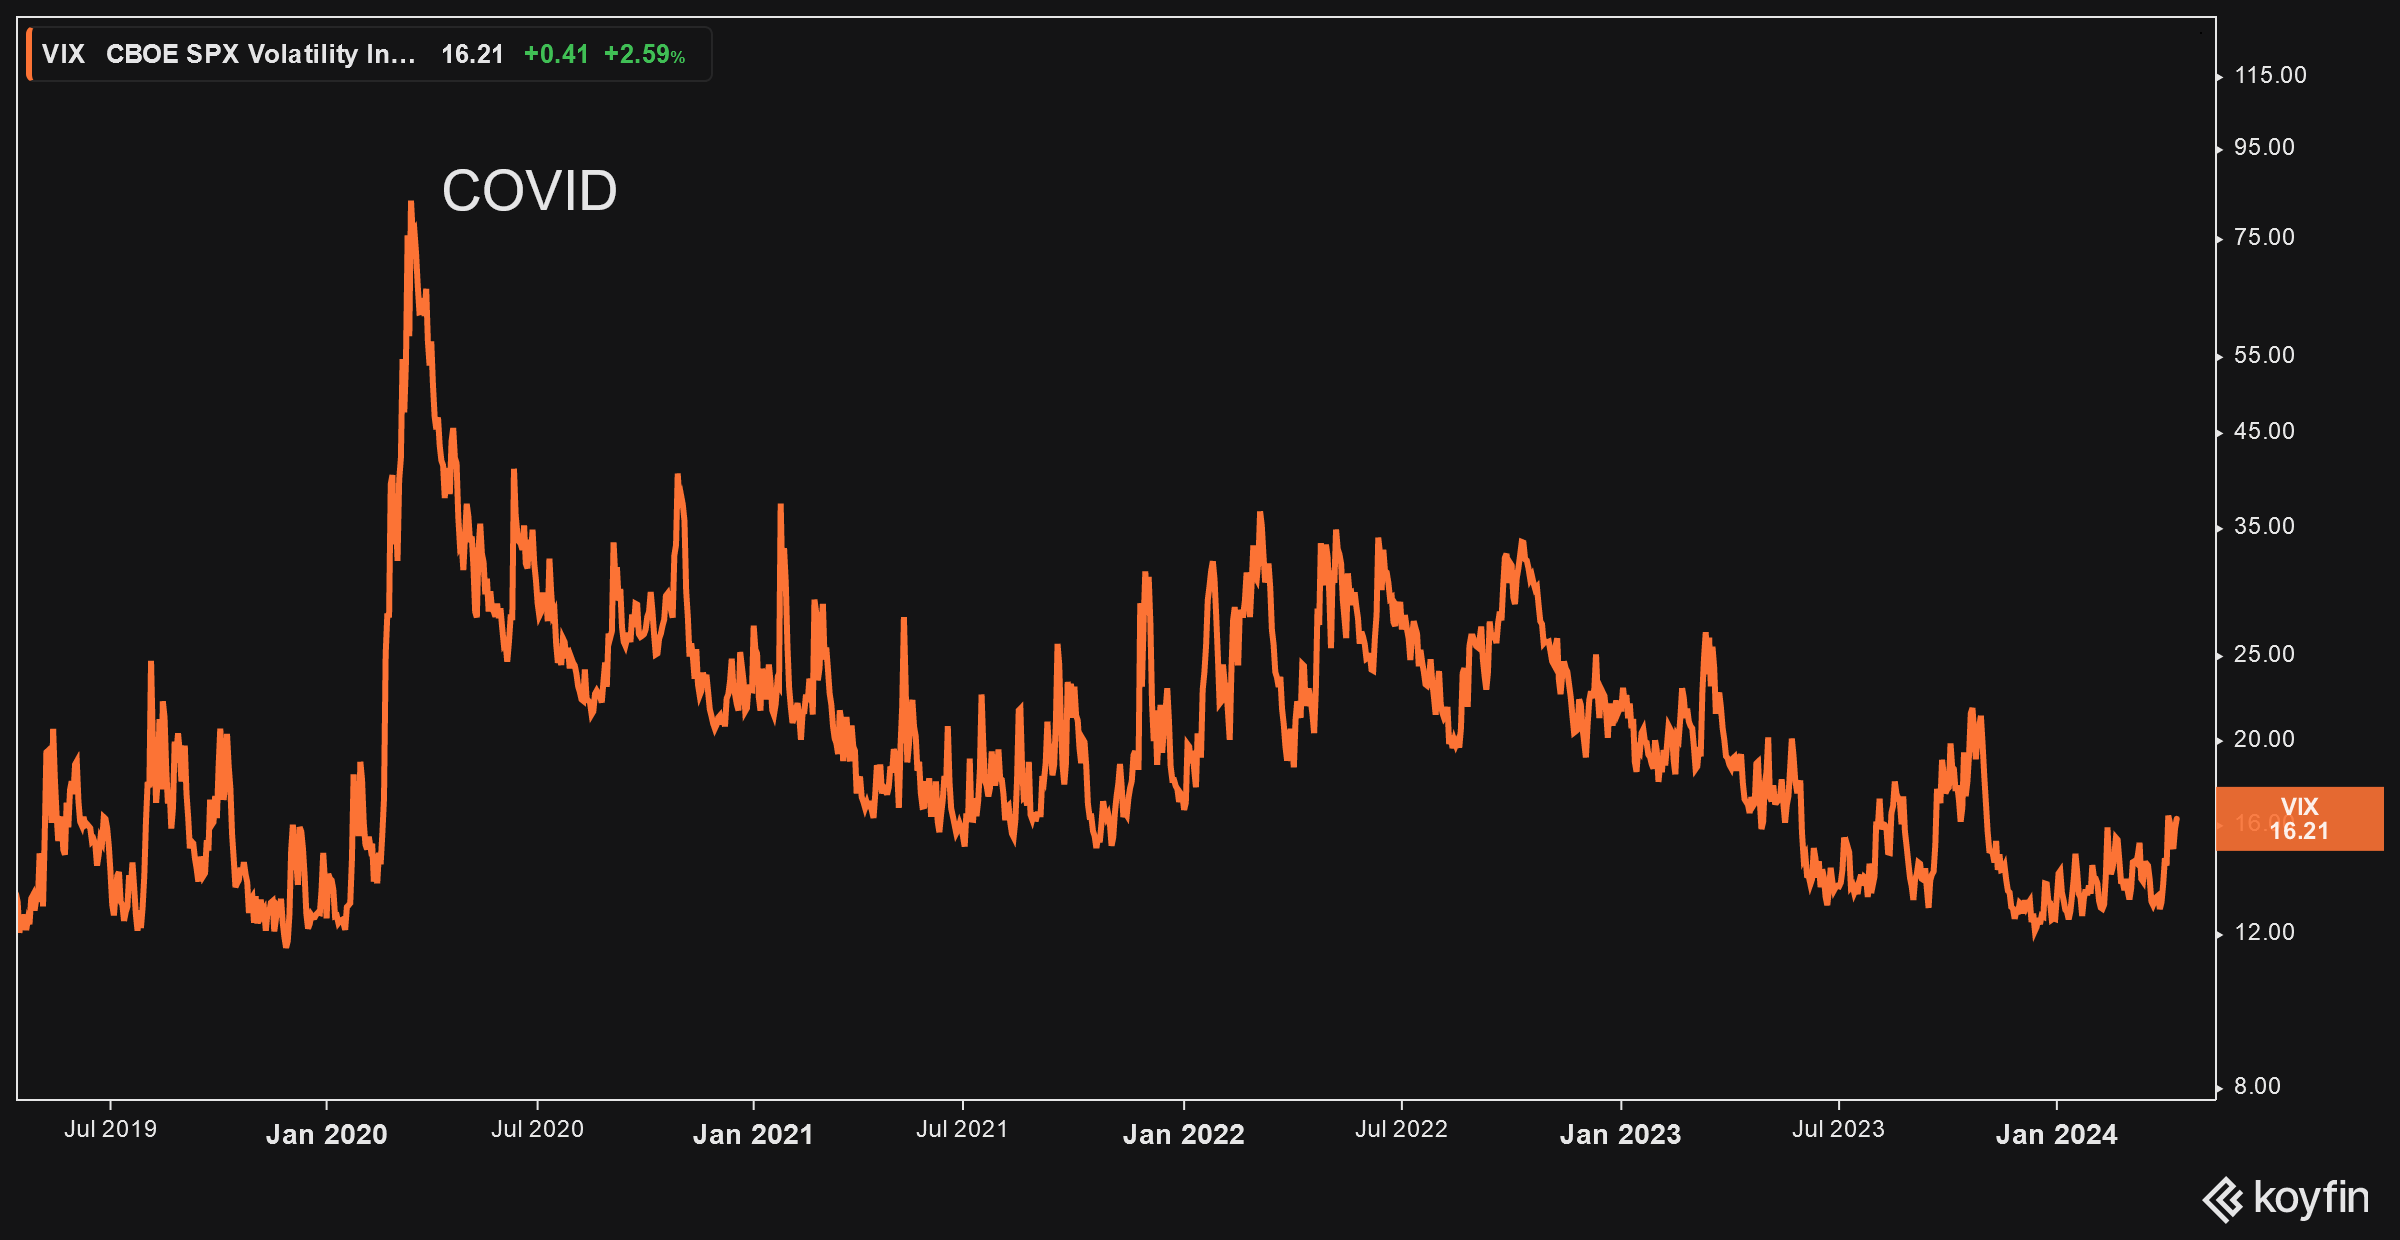
- During the COVID-19 pandemic in 2020, the VIX reached a peak of 82.69 on March 16, 2020, as markets grappled with the economic fallout of the global health crisis. Investors who recognized the heightened volatility and adjusted their portfolios accordingly, such as by reducing exposure to risky assets or implementing hedging strategies, were better positioned to weather the market turbulence.

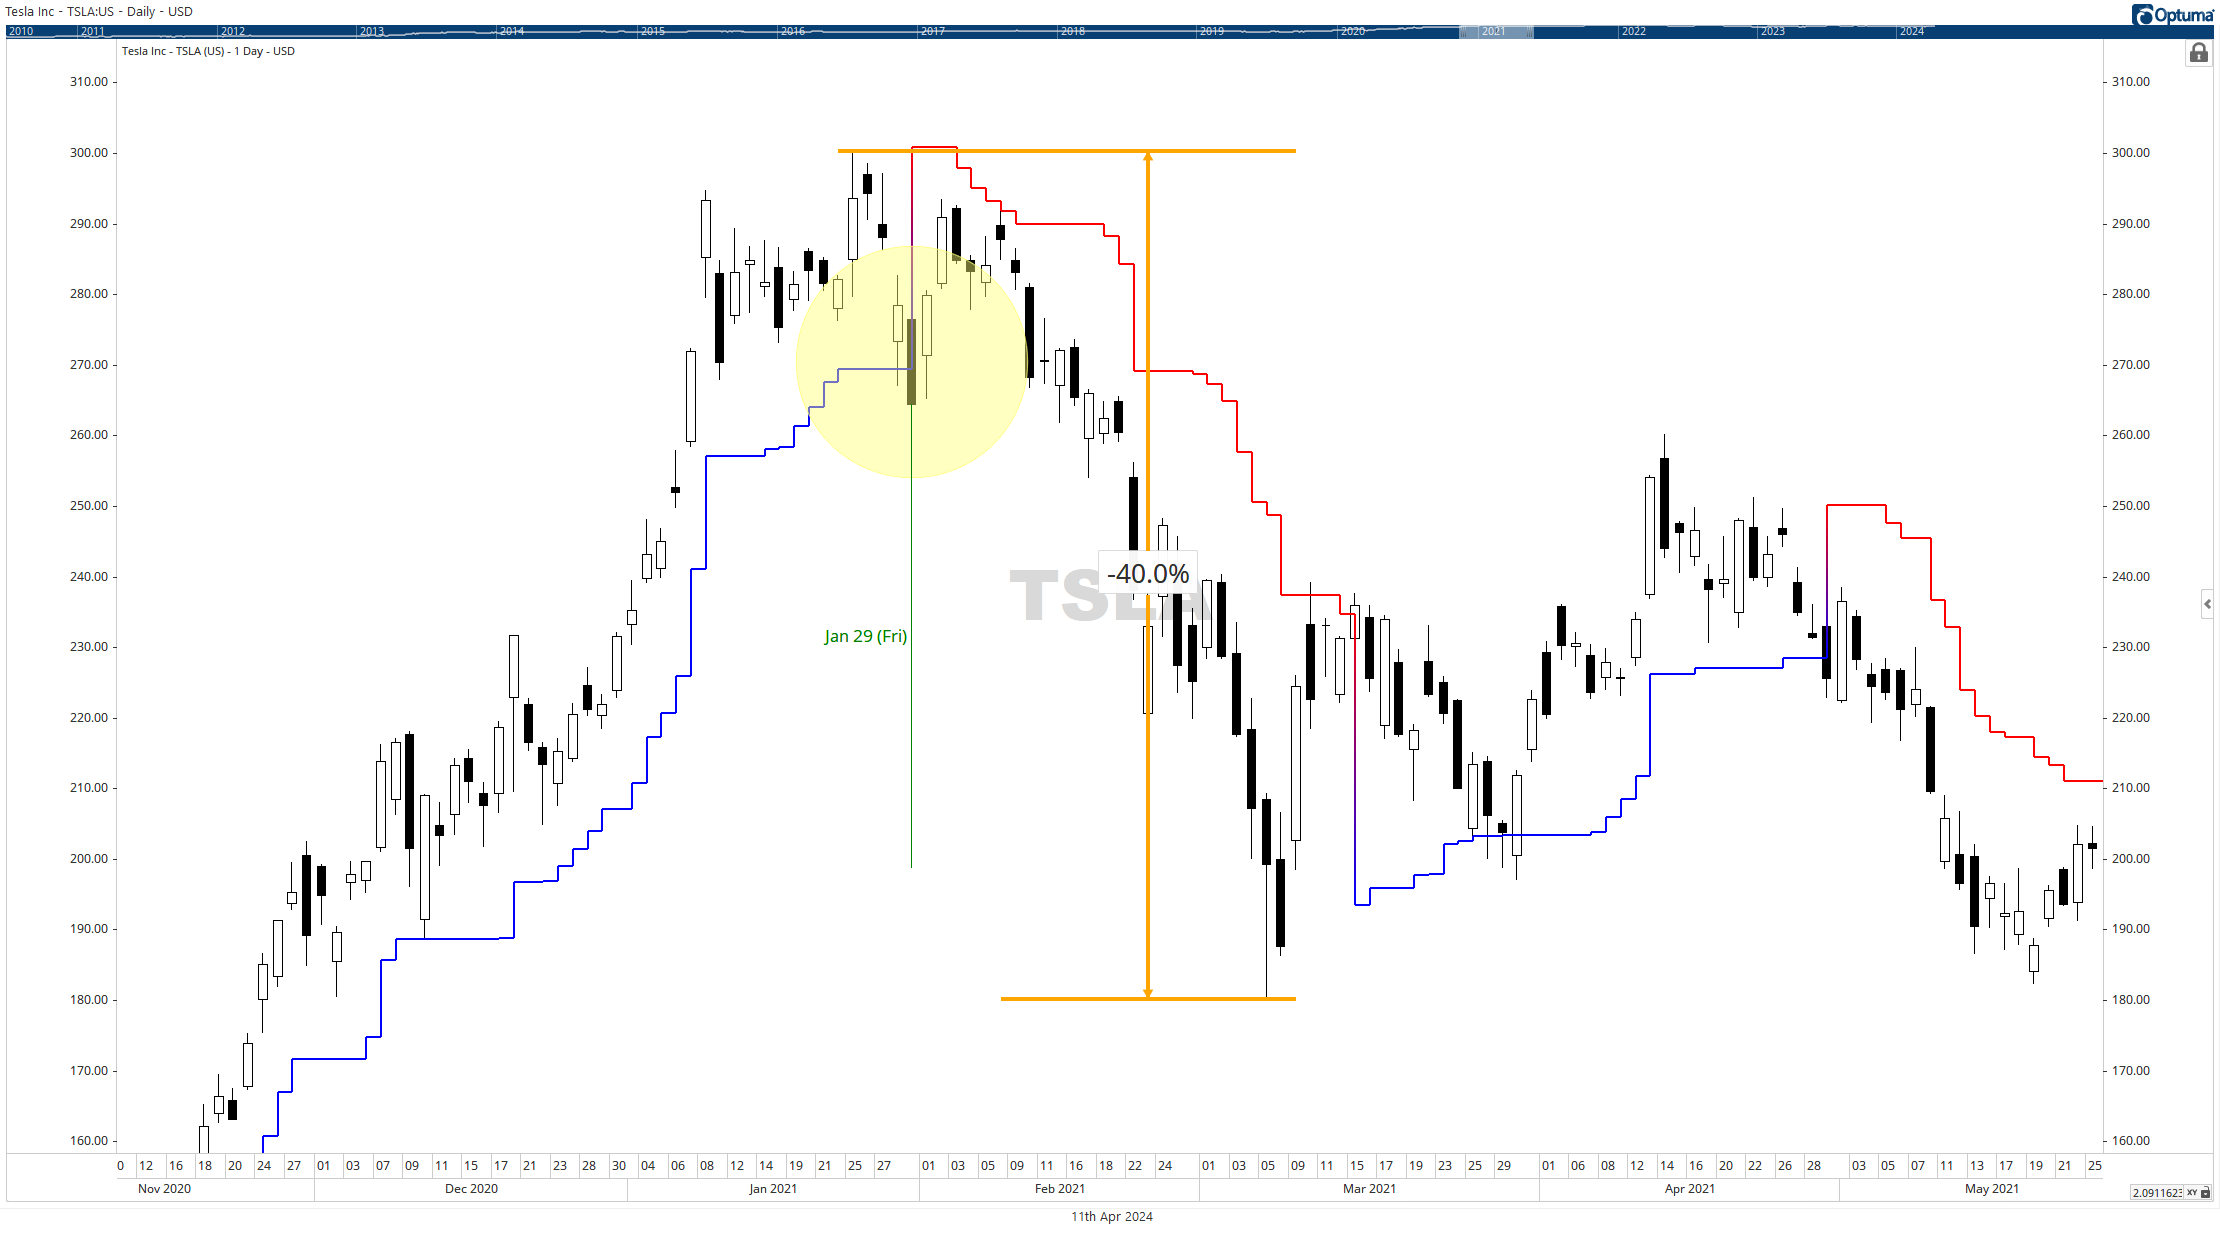
- In the case of Tesla (TSLA), its stock experienced a significant increase in late 2020, rising from around $132 in November to over $300 in January 2021. This surge in price preceded a sharp decline in the stock price, with TSLA dropping approximately 40%. Investors who used Wilder’s Voaltatilty Stop Loss could have used it as a warning sign of potential trend reversal and taken steps to manage their risk, such as tightening stop-loss orders or reducing their position size.

Volatility is a critical factor to consider when managing risk in the stock market. By understanding how the VIX reflects market fear and how changes in volatility at the individual stock level can signal potential trend reversals, investors can make more informed decisions and adjust their risk management strategies accordingly.
Utilizing indicators like ATR and Wilder’s Volatility Stop Loss can help identify significant changes in volatility that may warrant action, such as tightening stop losses, reducing position sizes, diversifying holdings, or implementing hedging strategies.
Real-world examples, such as the market volatility during the COVID-19 pandemic and the case of Tesla stock, demonstrate the importance of monitoring volatility and adapting risk management strategies accordingly. By incorporating volatility analysis into their investment approach, investors can navigate market uncertainties with greater confidence and potentially enhance their overall risk-adjusted returns.
Sources:
1. Wilder, W. (1978). New Concepts in Technical Trading Systems. Trend Research.
2. “VIX – CBOE Volatility Index.” CBOE, https://www.cboe.com/tradable_products/vix/.
3. “Understanding the VIX: What It Is, How It Works.” Investopedia, https://www.investopedia.com/terms/v/vix.asp.
4. “VIX Historical Price Data.” Yahoo Finance, https://finance.yahoo.com/quote/%5EVIX/history?p=%5EVIX.
5. “Average True Range (ATR).” Investopedia, https://www.investopedia.com/terms/a/atr.asp.
6. “VIX Surges to Record High as Stocks Plunge Amid Global Recession Fears.” CNBC, https://www.cnbc.com/2020/03/16/vix-surges-to-record-high-as-stocks-plunge-amid-global-recession-fears.html.
7. “Tesla, Inc. (TSLA) Stock Historical Volatility.” Macroaxis, https://www.macroaxis.com/volatility/TSLA/Tesla.
8. “Tesla, Inc. (TSLA) Stock Historical Prices & Data.” Yahoo Finance, https://finance.yahoo.com/quote/TSLA/history?p=TSLA.
9) “Wilder Volatility Stop” https://www.optuma.com/kb/optuma/tools/volatility/wilder-volatility-stop
Featured Image: Image by macro vector on Freepik

