Further Crash or Is It Time to Buy?
Global stock markets aggressively sold off on the news that US tariffs would be more significant than expected.
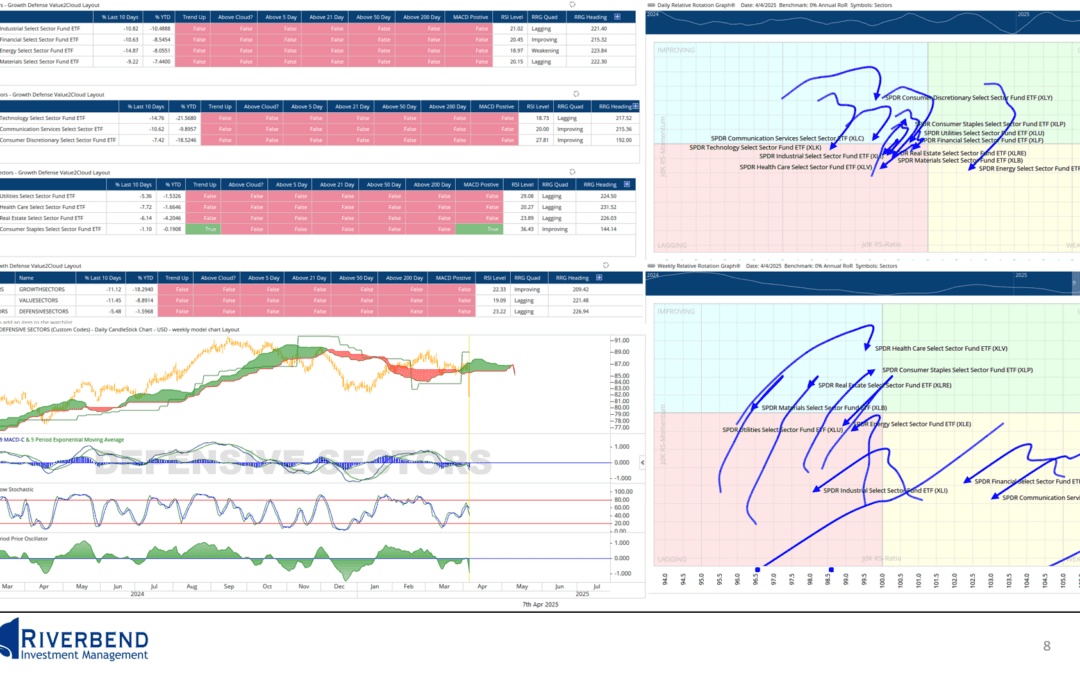
Will the market continue to decline, or is the selling overdone?
This week, I discuss key levels to watch, what signals I am watching, and where this pullback stands compared to other historical market declines.