Small Businesses Owners Still Facing Challenges

Small Businesses Owners Still Facing Challenges

Small Businesses Owners Still Facing Challenges


Despite an improving economy, small business owners are still facing challenges. The data points that these business owners provide is something that should not be ignored.

There are more than 30 million small businesses in the United States, as reported by the Small Business Administration. It’s worth noting that small businesses make up approximately 99% of all businesses in the country. Moreover, these establishments employ nearly half of all Americans, equating to around 60 million individuals working for smaller companies.

Are Businesses Owners Feeling More Optimistic?

On Tuesday, the NFIB’s Small Business Optimism Index increased 1.6 points in June to 91.0, however, it is the 18th consecutive month below the 49-year average of 98.

NFIB Survey results

When analyzing the top concerns of small business owners, both inflation and labor quality are tied for the first place, with approximately 24% of owners reporting each as their single most important problem.

On a positive note, the net percentage of owners raising average selling prices has decreased by three points, landing at a seasonally adjusted net of 29%. While this level remains significantly inflationary, it is showing a positive downward trend.

It’s essential to mention that this is the lowest reading since March 2021, further emphasizing the importance of monitoring the current trends in the small business landscape for a comprehensive understanding of the market.

Additional findings included that:

  • Small business owners expecting better business conditions over the next six months improved 10 points from May to a net negative 40%, 21 percentage points better than last June’s reading of a net negative 61%.
  • Forty-two percent of owners reported job openings that were hard to fill, down two points from May but remaining historically very high.
  • The net percent of owners who expect real sales to be higher improved seven points from May to a net negative 14%.

Challenges Facing Small Businesses

According to the latest NFIB monthly jobs report, it appears that small businesses are facing challenges in their hiring efforts. In June, 59% of owners indicated that they were either actively hiring or attempting to do so, which represents a decrease of four points compared to May.

Shockingly, 92% of these business owners reported that they encountered a severe shortage of qualified applicants for vacant positions.

small business hiring John Rothe

Sources: nfib.com, FMeX

Moreover, small businesses seem to be curbing their spending habits as well.

In the past six months, 53% of owners reported capital outlays, which is a four-point decrease from May. Among those who made expenditures, 37% invested in new equipment, while 21% acquired vehicles.

Additionally, 14% focused on improving or expanding their facilities, and 8% allocated funds for new fixtures and furniture. Lastly, 6% even went as far as acquiring new buildings or land for future expansion.

These numbers clearly indicate the current state of affairs for small businesses, highlighting the uphill battle they face in terms of hiring and financial decisions.

Economic Headwinds Facing Investors

Economic Headwinds Facing Investors

The stock market had a strong start to 2023, with the S&P 500 finishing January with nearly a 6% gain. However, that trend began to reverse, as investors started to weigh the impact of numerous economic changes and challenges – such as mixed inflation data, bank failures, and a continued shortage of workers.

Below is a summary of potential headwinds facing investors during the second quarter of 2023.

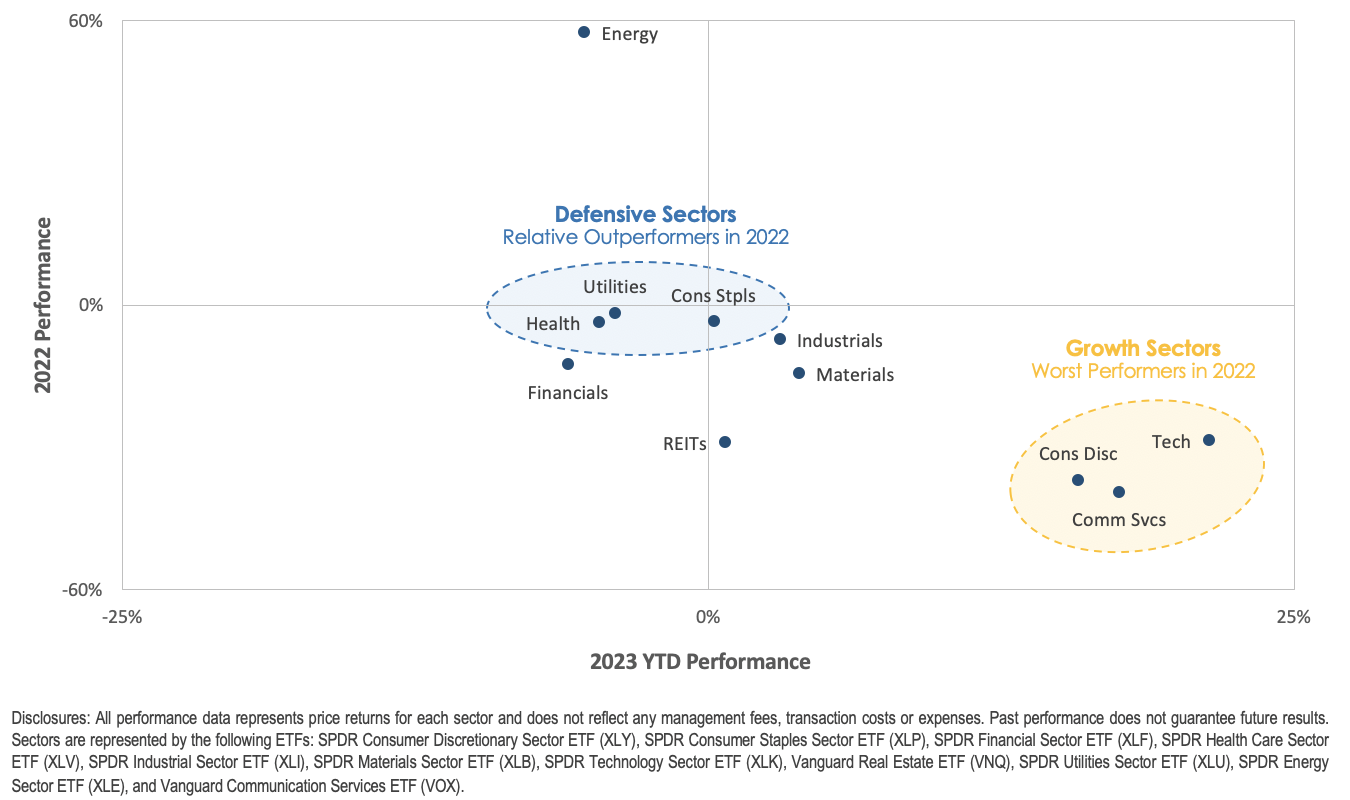
U.S. Sector Performance Reverses During 1Q 2023

The start of 2023 has been an intriguing one for the stock market. Generally, the sectors that performed poorly in 2022 are performing well in 2023, while the top-performing sectors in 2022 are underperforming in 2023.

Notably, there has been a remarkable performance turnaround in Growth-style sectors, which includes Technology, Communication Services, and Consumer Discretionary.

These sectors went from being the worst-performing sectors in 2022 to the top three-performing sectors in the first quarter of 2023. This market rotation should be noted since it could signify a shift in investor psychology, as they redirect investments toward underperforming asset classes, potentially indicating a boost in investor confidence.

There could be various catalysts that explain this reversal of fortune. Firstly, growth sectors suffered in 2022 due to the Federal Reserve’s interest rate hikes, which weighed down expensive growth stock valuations.

Secondly, growth stocks are usually businesses with more robust fundamentals, which could explain why investors capitalized on their oversold nature and stronger fundamentals to shift towards higher quality companies, especially after concerns about the U.S. financial system’s stability following bank failures. Market observers will be keeping a close eye on the situation.

stock market performance Q1 2023

Source: MarketDesk

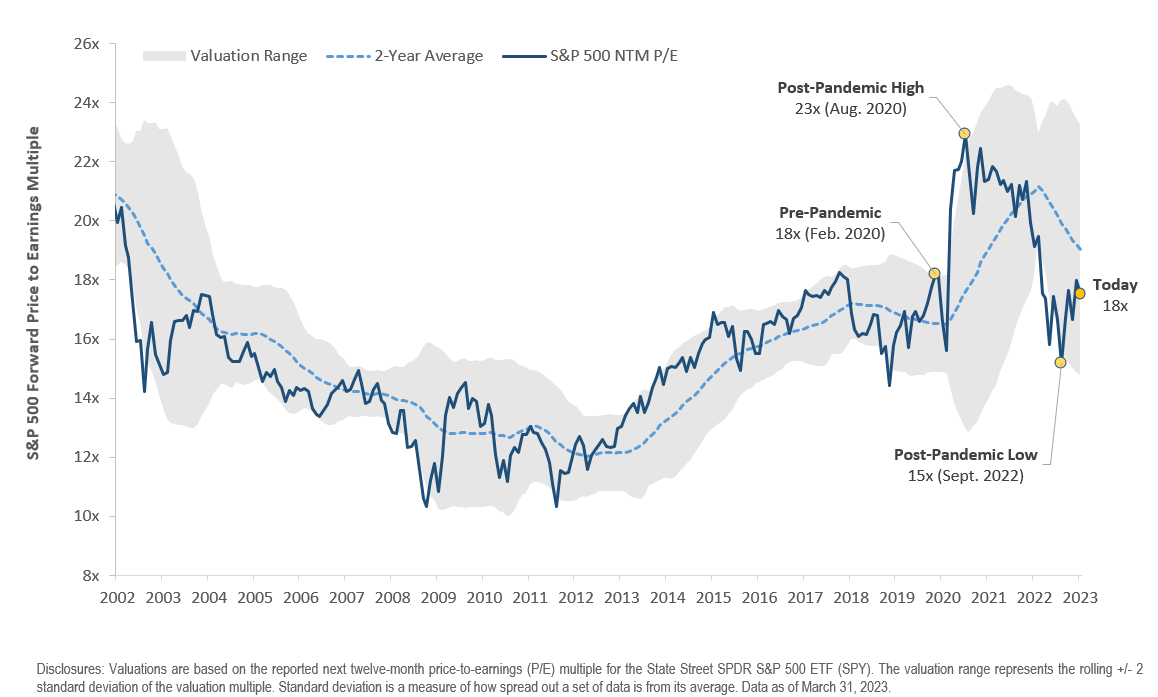
S&P 500’s Valuation Multiple – Overvalued or Undervalued?

S&P 500 Current Valuation Chart

At the start of the pandemic, the S&P 500’s earning multiple surged after the Federal Reserve cut interest rates to 0%, and for the most part of 2021, it remained stable to slightly lower as corporate earnings recovered, and the S&P 500 grew into its valuation. However, the earning multiple took a nosedive in 2022 as the Federal Reserve raised interest rates aggressively, which had an impact on expensive Growth stock valuations.

With the constant stream of news and economic data, it’s easy to forget what you’re investing in.

As of the end of the first quarter, the S&P 500 is trading at approximately 18x its next-12 month earnings, compared to the average of 16x since 2000.

The data indicates that investors are paying a premium over the long-term average, but current multiples are within the range from 2015-2020.

The upcoming earnings season, starting in mid-April will be the next test for the S&P 500 and give investors a better idea of the impact higher rates are having on earnings.

A Simple Explanation of Recent Bank Failures

Why did the banks fail in 2023?

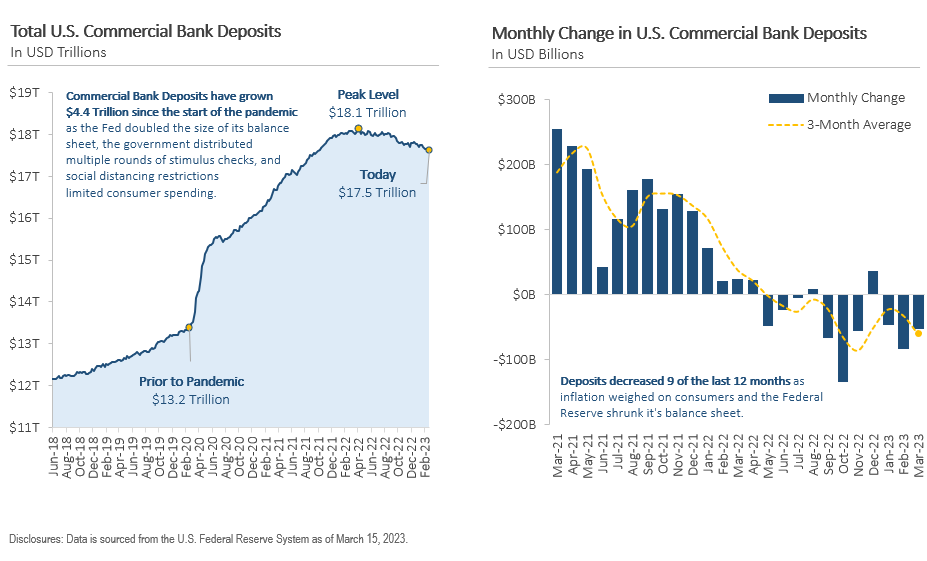
The banking industry is currently experiencing a crisis of confidence as depositors withdraw their checking deposits in search of higher yields. Deposits at U.S. commercial banks rose significantly from $13.2 trillion at the end of 2019 to a peak of $18.1 trillion in April 2022, as individuals and businesses flocked to banks during the pandemic. However, deposits have decreased in 9 of the last 12 months, placing pressure on some banks’ balance sheets.

Recently, three banks faced an overwhelming number of withdrawal requests in early March.

In order to fulfill these requests, they sold portions of their bond portfolios, including government bonds and mortgage-backed securities. However, interest rates are now significantly higher than when the banks originally purchased these bonds, resulting in significant losses when they were sold.

These losses have drained the banks’ capital cushions and left them technically insolvent. Fortunately, state banking regulators and the FDIC stepped in to take over the failed banks and protect depositors.

While recent bank failures have raised concerns about financial stability and drawn comparisons to the 2008 financial crisis, there are significant differences between the two events.

Regulatory changes since 2008 have strengthened the overall financial system, with higher capital requirements providing banks with a more robust financial cushion. Additionally, the cause of the recent bank failures was rapid interest rate increases by the Federal Reserve, which resulted in paper losses for banks. In the weeks following, the Federal Reserve implemented new lending programs to prevent a wider banking crisis. Markets will be closely monitored for signs of contagion in the coming months.

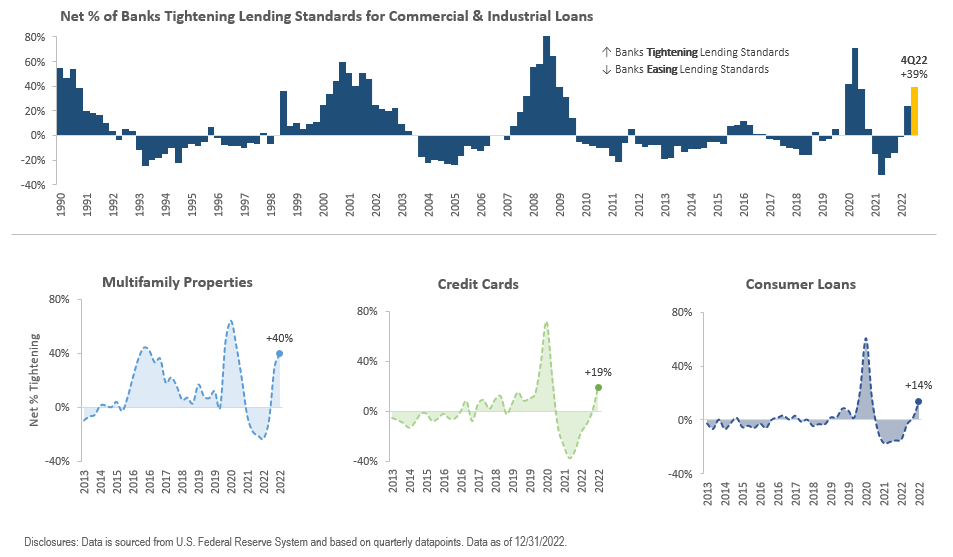
Banks Tighten Lending Standards for Consumer & Business Loans

banks are tightening lending

The above chart depicts the net percentage of banks that have tightened their lending standards across different loan categories, such as consumer loans, credit cards, commercial and industrial loans, and multifamily rentals.

The tightening of lending standards can manifest in several ways, such as increased creditworthiness requirements, higher interest rate spreads, reduced maximum loan sizes, and shorter maturities. Banks may also require more collateral, impose more restrictive loan covenants, and raise loan-to-value ratios.

Tighter lending standards may impede economic growth by limiting credit availability and borrowers’ ability to invest and borrow. This tightening could decrease the overall credit supply, making it challenging for borrowers, particularly high-yield issuers, to refinance their maturing loans, thereby increasing the risk of default.

To mitigate this risk, investors may consider owning bonds from high-quality companies with low refinancing risk.

The recent bank failures and concerns about the stability of checking deposits may also tighten lending standards further. Banks may adopt a more cautious lending approach and further reduce the total amount of credit they offer due to the uncertain timing of depositor withdrawal requests.

This could decrease credit supply and access to credit, which could eventually impact the economy and financial markets.

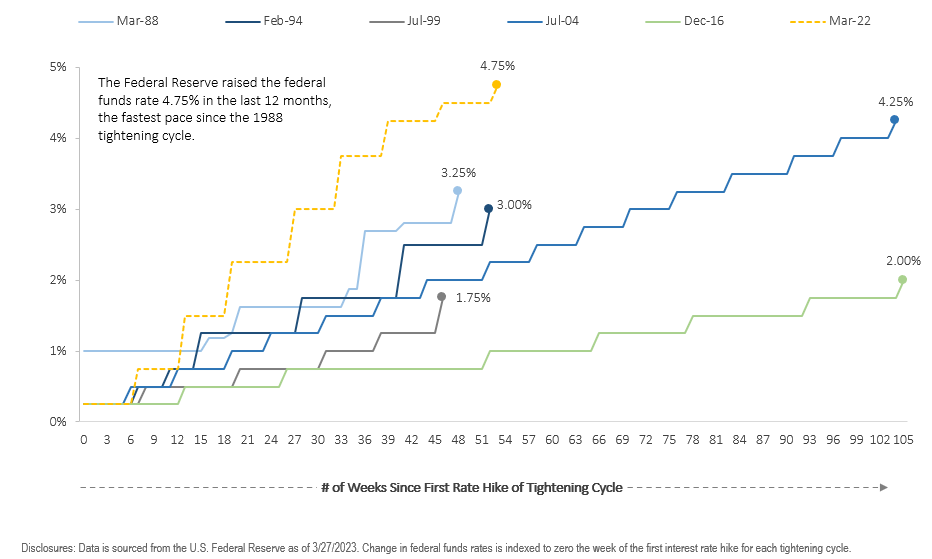
A Look at Interest Rate Increases Across Tightening Cycles

comparing 2023 interest rate cycle with past rate hikes

The current tightening cycle, which began in March 2022, is significantly more aggressive when compared to the last five tightening cycles. The Federal Reserve has increased the federal funds rate by 4.75% over the past 12 months, the quickest rate of increase since the 1988 tightening cycle.

The central bank’s next meeting is scheduled for May 2-3, but it is unclear if it will continue to raise interest rates following recent bank failures.

The rapid interest rate hikes have already had multiple consequences.

Bond prices declined in 2022, weighing on the fixed-income portion of portfolios. This decline also contributed to the recent bank failures, as it reduced the value of bonds on banks’ balance sheets, causing them to realize losses when depositors rushed to withdraw their checking deposits.

However, some effects may not be immediately apparent, as tightening historically occurs with a lag. It takes time for higher interest rates to affect the economy, and there is uncertainty about how the current cycle will play out in the real world.

The direction of central bank policy is still highly uncertain and subject to change as new information becomes available. Regardless of the path, it will have implications for investors’ portfolios.

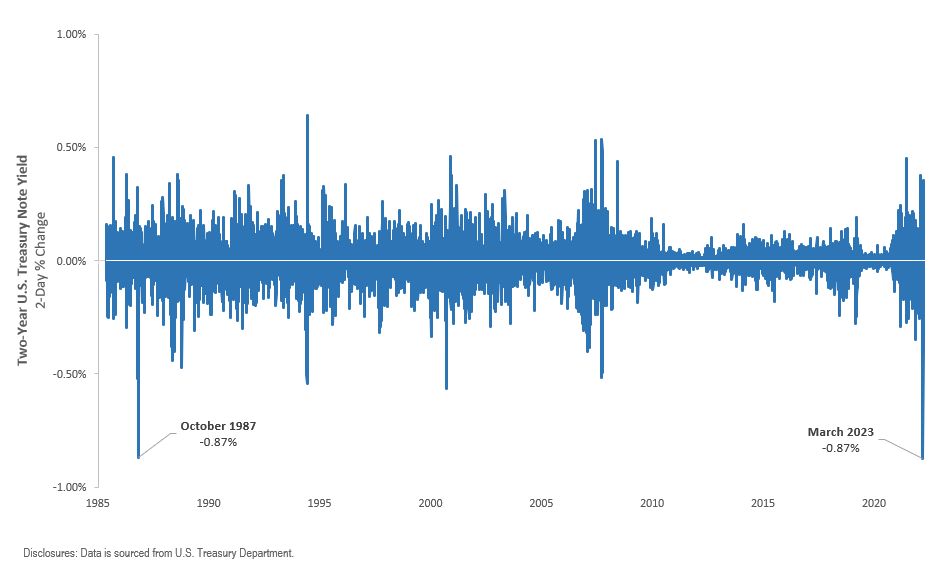
Recent Interest Rate Volatility in the U.S. Treasury Market

Interest Rate Volatility

Above, we can see the fluctuations in interest rates in the U.S. Treasury market, focusing on the 2-year U.S. Treasury note’s rolling 2-day percentage change in yield since 1985. Inflation and the Federal Reserve’s aggressive interest rate hikes led to increased volatility in 2022, which continued in Q1 2023.

The first quarter of 2023 saw a mix of factors contributing to interest rate volatility. Federal Reserve Chair Jerome Powell’s comments about the possibility of further interest rate hikes, followed by the failure of two regional banks, led to conflicting expectations among investors. The largest two-day drop in the 2-year Treasury yield since 1987 followed as investors became worried about the stability of the U.S. financial system.

The Federal Reserve is now facing the challenging task of balancing inflation control with minimizing damage to the economy and preventing financial market instability.

The uncertainty of how 2022’s rate hikes have affected the economy and recent bank failures are contributing to interest rate volatility. As a result, there is little consensus on the direction of Federal Reserve policy for 2023 and beyond, which may continue to impact interest rate volatility.

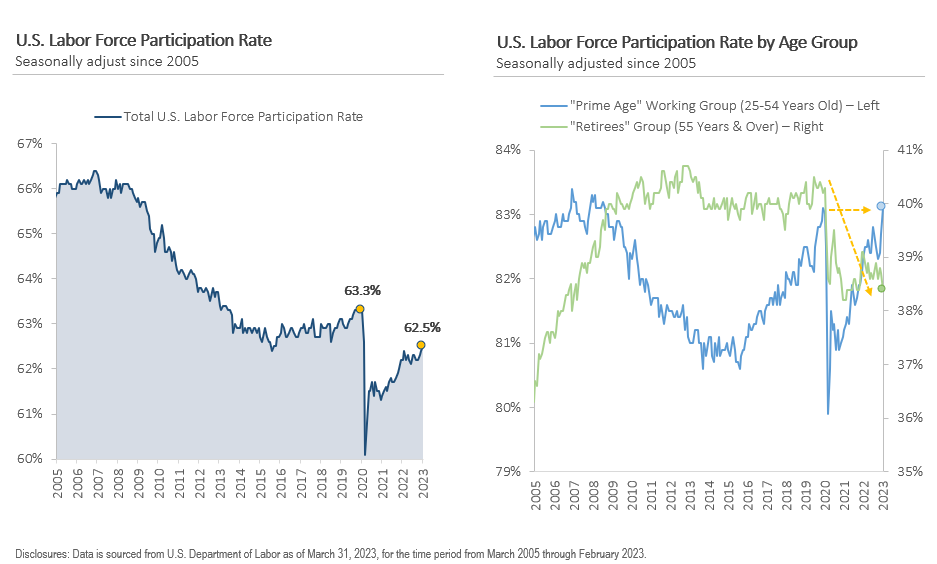
Labor Market Participation Rebounds Despite Early Retirements

labor participation rate

The U.S. labor force participation rate, which measures the proportion of individuals who are employed or actively seeking employment is at 62.5% as of February 2023, which is 0.8% lower than its level in February 2020.

Why is the participation rate still below pre-pandemic levels? The answer lies in the age-specific divergence in the participation rate.

To better understand why the participation rate is lower now than in February 2020, we need to take a closer look at two groups: Prime Age (25-54 years old) and Retirees (55 years & over).

During the pandemic, labor participation decreased for both groups as individuals left the labor market due to various reasons, including virus concerns, childcare responsibilities, and early retirements. However, the participation rate for the Prime Age group has surpassed its pre-pandemic level, whereas the Retiree group remains -2% lower than in February 2020 and close to its lowest level since 2007.

The tightness of the labor market contributed to high inflation during the pandemic recovery period. As economic activity surged and labor supply dwindled, businesses struggled to find adequate employees. As a result, employers raised wages to retain current workers and attract new ones, leading to wage inflation.

The rebound in the participation rate has helped moderate wage inflation. However, if the participation rate remains low, the labor market may continue to generate inflationary pressures in the years to come.

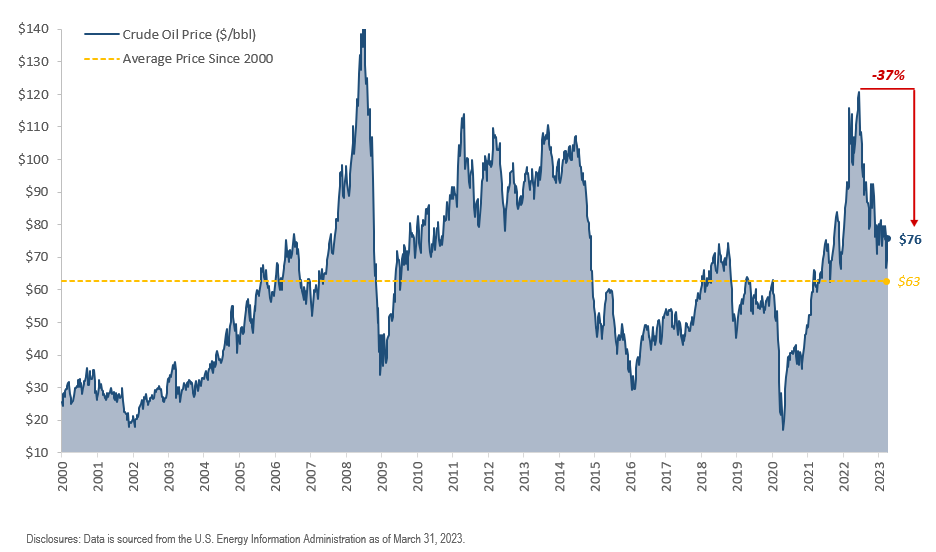
Global Oil Prices Drop to 16-Month Low Due to Demand Concerns

Demand for oil

After a sharp decline early in the pandemic, crude oil prices rebounded as the economy stabilized and activity increased in 2020 and 2021.

However, Russia’s invasion of Ukraine in early 2022 disrupted commodity markets, causing oil prices to drop back to 2008 levels. Since then, central banks’ aggressive interest rate increases have negatively impacted demand, resulting in the steepest first-quarter drop in crude oil prices since 2020.

The decrease is attributed to concerns about a potential U.S. recession, robust Russian oil flows despite sanctions, and bank failures, which have raised concerns that tighter lending standards may slow economic activity and decrease demand for oil.

However, Asia is showing signs of demand recovery as China reopens its economy after ending its Covid Zero policy in late 2022.

While the steady rise in oil prices in the past has led to a surge in global inflation, recent data indicates that inflationary pressures are easing, with year-over-year inflation growth declining each month since peaking at +8.9% y/y in June 2022.

If crude oil prices remain stable or continue to decline, it could help to alleviate inflation pressures and allow central banks to slow down their tightening pace. But if oil prices rebound, inflationary pressures could persist.

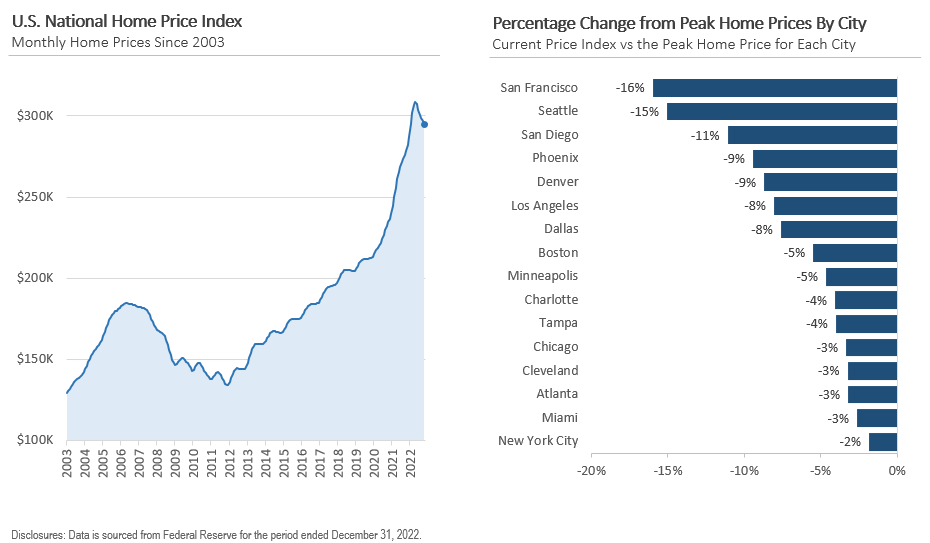
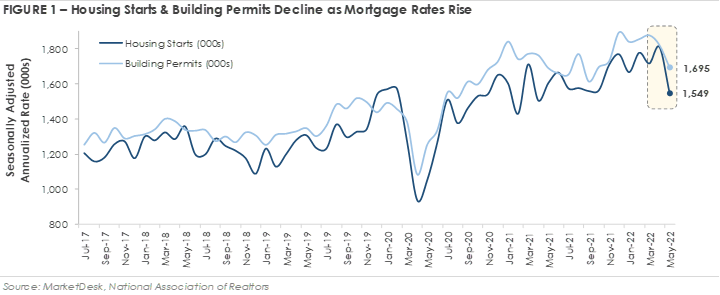
Is the Housing Market Cooling Off? 

Trend in home prices

Home prices sharply increased in 2020 as a result of historically low mortgage rates and an increase in demand from remote work and migration. Consequently, some cities saw year-over-year increases of 15% or more in home prices.

In the second half of 2022, home prices started to decline due to the Federal Reserve’s interest rate hikes. The average 30-year fixed-rate mortgage has risen to levels not seen since 2007, making monthly payments more expensive and reducing demand for homes. As a result,  home prices have fallen across most U.S. cities, and there could be further room for decline as mortgage rates remain high and lending standards tighten.

Nevertheless, one stabilizing factor could be that homeowners who secured low-interest rates in recent years may have little incentive to sell their homes and obtain new loans at current interest rates. This limited housing supply may prevent a significant decrease in home prices.

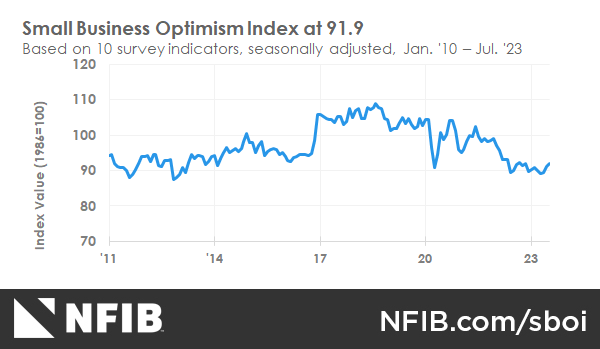
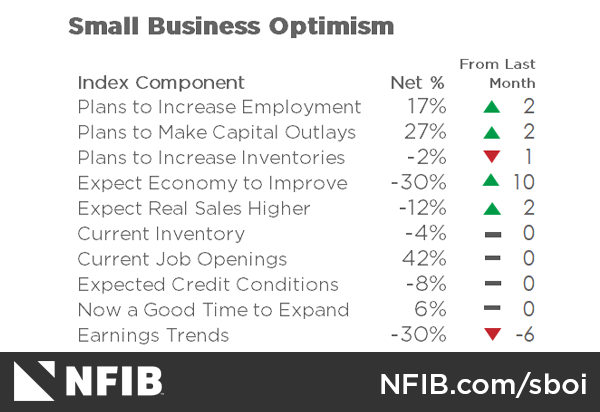
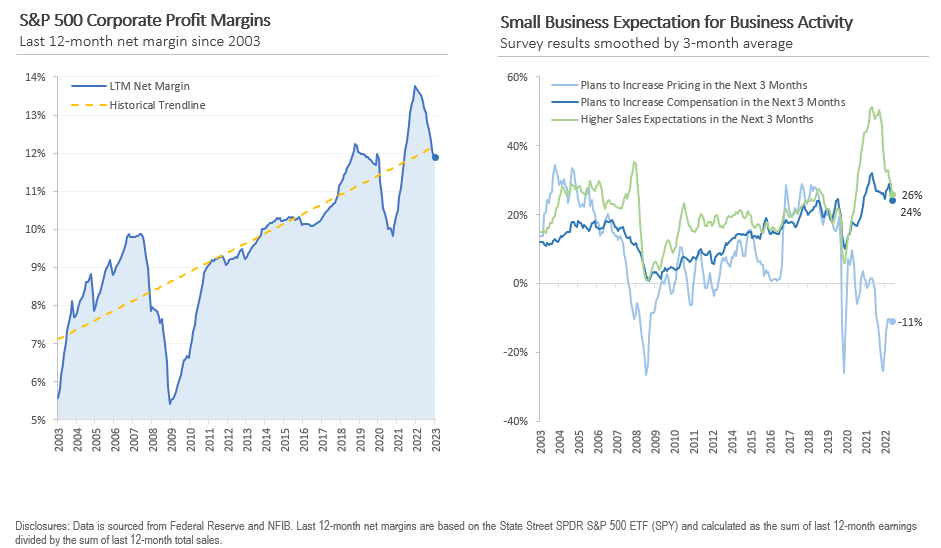
Corporate Profit Margins & Small Business Survey Results

Corporate profit margins

Finally, let’s review the corporate profit margins and the latest survey of small business owners.

On the left side, the above chart displays the S&P 500’s profit margins for the past 12 months on a quarterly basis since 2003. The two main points to highlight are that corporate profit margins increased significantly during the pandemic due to the robust economy and pricing power.

However, profit margins usually decline when the economy contracts. Profit margins have been decreasing lately, and investors will monitor earnings closely to observe if margins will stabilize in the upcoming quarters.

On the right side, the chart illustrates the outcomes of the National Federation of Small Business survey, which measures the sentiment and confidence of U.S. small business owners monthly. Small business owners foresee a rise in wages and prices over the next three months, but the sales outlook is predicted to be weaker, with expectations of lower sales.

Pricing power and expense management will be critical to maintaining profit margins, especially with the possibility of demand declining.


John Rothe

HAS BEEN FEATURED IN:

Barrons-John-Rothe
Reuters-John-Rothe
US-News-John-Rothe
Financial-Planning-John-Rothe
Advisor-Perspectives-John-Rothe
John Rothe CMT
John Rothe NAAIM
Investment Advisor
Registered Investment Advisor

© 2023 John Rothe

The opinions expressed on this site are those solely of John Rothe and do not necessarily represent those of Riverbend Investment Management LLC (Riverbend). This website is made available for educational and entertainment purposes only. Mr. Rothe is an Investment Adviser Representative of Riverbend. This website is for informational purposes only and does not constitute a complete description of the investment services or performance of Riverbend. Nothing on this website should be interpreted to state or imply that past results are an indication of future performance. A copy of Riverbend’s Part II of Form ADV and privacy policy is available upon request. This website is in no way a solicitation or an offer to sell securities or investment advisory services. Mr. Rothe and Riverbend Investment Management LLC (Riverbend) disclaim responsibility for updating information. In addition, Mr. Rothe, and Riverbend disclaim responsibility for third-party content, including information accessed through hyperlinks.

Is International Finally Ready to Shine?

Is International Finally Ready to Shine?

Over the past decade, U.S. investors benefitted significantly by investing at home rather than abroad, as U.S. stocks significantly outperformed their international counterparts. As illustrated in Figure 1, an initial investment of $1,000 in the S&P 500 at the end of 2012 grew to $2,613, excluding dividends, by the end of 2022.

For comparison, the same $1,000 investment in the MSCI Developed Market Index returned only $1,142, while a $1,000 investment in the MSCI Emerging Market Index posted a loss and returned $842.

Looking back at the last decade, investment analysts attribute the outperformance of U.S. stocks to several factors. One major contributing factor is the composition of the S&P 500 Index, which is heavily weighted towards technology and other growth-oriented stocks such as Apple, Amazon, Microsoft, Google, and Tesla.

Image for global valuations John-Rothe


This high concentration of technology stocks is not found anywhere else around the world, and as the group outperformed, so did the broader U.S. stock market. Additionally, the U.S. dollar strengthened by approximately 30% over the last decade, which decreased the value of foreign investments when translated back into U.S. dollars.

These two catalysts benefitted U.S. stocks while acting as a headwind for international stocks.

Today international stocks currently trade at more attractive valuations than U.S. stocks after a decade of underperformance. As illustrated in Figure 2, U.S. stocks trade at a higher next 12-month price-to-earnings multiple than international stocks. In addition, U.S. stocks trade more expensive against their historical valuation range, as evidenced by the 10th to 90th percentile range of historical price-to-earnings multiples.

Given the current valuation backdrop, growth stocks’ underperformance in 2022, and recent U.S. dollar weakness, international stocks may become more of a focus for investors in 2023.

Consumers Turn to Credit Cards as Inflation Pressures Finances

Consumers Turn to Credit Cards as Inflation Pressures Finances

This month’s charts examine the trend of increasing consumer credit usage. Figure 1 charts the amount of outstanding revolving consumer credit, and Figure 2 charts the year-over-year percentage growth of revolving credit. Revolving credit, such as a credit card, allows the account holder to borrow money repeatedly up to a set credit limit while making monthly payments. The charts show credit usage initially decreased during the pandemic as consumers used government stimulus checks and savings from fewer discretionary purchases to pay down debt.

After declining during the pandemic, data shows consumer credit usage is rising again and now back above pre-pandemic levels. The increase in credit usage started during 2021 as the effect of stimulus checks faded and the economic reopening released a wave of pent-up demand. Credit usage continues to increase during 2022 as inflation increases the price of everyday necessities, such as gas, groceries, and housing.

The increase in consumer credit usage raises an important point. Credit cards are an easy and common way to borrow money, but they are also one of the most expensive forms of borrowing. Most credit cards charge a variable interest rate tied to the prime rate, which is linked to the federal funds rate.

This year’s interest rate increases by the Federal Reserve are intended to ease inflation pressures, but they also make carrying a credit card balance more expensive. An increase in the federal funds rate increases the prime rate, which in turn increases the interest rate charged on credit cards. According to a recent survey by Bankrate.com, the average credit card interest rate reached 17.96% at the end of August, which marks the highest level since 1996.

The increase in mortgage and auto loan rates is getting all the attention this year, but the increase in credit card interest rates is more impactful to everyday life. Credit cards are a valuable tool to manage your personal finances, such as building up a credit score, increasing your purchasing power, and earning rewards. However, credit cards can also create negative issues, such as overspending, high balances, and high interest expenses, when misused and mismanaged.

Inflation and Credit Card Use


US Economy: Declining Labor Productivity & Rising Labor Costs

US Economy: Declining Labor Productivity & Rising Labor Costs

[fusion_builder_container type=”flex” hundred_percent=”no” equal_height_columns=”no” menu_anchor=”” hide_on_mobile=”small-visibility,medium-visibility,large-visibility” class=”” id=”” background_color=”” background_image=”” background_position=”center center” background_repeat=”no-repeat” fade=”no” background_parallax=”none” parallax_speed=”0.3″ video_mp4=”” video_webm=”” video_ogv=”” video_url=”” video_aspect_ratio=”16:9″ video_loop=”yes” video_mute=”yes” overlay_color=”” video_preview_image=”” border_color=”” border_style=”solid” padding_top=”” padding_bottom=”” padding_left=”” padding_right=””][fusion_builder_row][fusion_builder_column type=”1_1″ layout=”1_1″ background_position=”left top” background_color=”” border_color=”” border_style=”solid” border_position=”all” spacing=”yes” background_image=”” background_repeat=”no-repeat” padding_top=”” padding_right=”” padding_bottom=”” padding_left=”” margin_top=”0px” margin_bottom=”0px” class=”” id=”” animation_type=”” animation_speed=”0.3″ animation_direction=”left” hide_on_mobile=”small-visibility,medium-visibility,large-visibility” center_content=”no” last=”true” min_height=”” hover_type=”none” link=”” border_sizes_top=”” border_sizes_bottom=”” border_sizes_left=”” border_sizes_right=”” first=”true”][fusion_text]

The US economy is facing a trend not seen in decades – declining labor productivity and rising labor costs. Figure 1 shows labor productivity, which is measured as economic output per hour worked, declined -2.5% year-over-year during the second quarter. The -2.5% decline in labor productivity is the largest decline in the data series, which began in the first quarter of 1948. Hourly compensation rose +6.7% year-over-year as a tight labor market drove strong wage growth.Declining labor costs

A look at the underlying data provides additional context on declining productivity. Total output rose +1.5% compared to the same quarter a year ago, while hours worked rose a bigger +4.1% year-over-year. The data indicates workers produced more goods and services less efficiently. Why is productivity declining? One potential explanation is pandemic-related themes, such as remote work and inflation, make the process of measuring productivity more difficult and distort the data.

Thematic changes may also explain the productivity decline. The labor market experienced significant turnover during the pandemic, and it takes time for workers to learn new jobs. As an example, Delta’s CEO pointed to labor turnover as a cause of the airline’s recent operational issues: “Since the start of 2021, we’ve hired 18,000 new employees, and our active head count is at 95% of 2019 levels, despite only restoring less than 85% of our capacity. The chief issue we’re working through is not hiring, but of training and experience bubble.”

In addition, capacity constraints may also be weighing on productivity. The capacity utilization rate, which measures the amount of potential output that is actually being realized, was 80% during June 2022. The peak utilization rate over the past 20 years was ~81%, suggesting businesses may be running up against the limit of how much capacity they can use efficiently.

The combination of declining productivity and rising compensation costs is a notable trend, and it remains to be seen whether it is a short-term phenomenon or start of a longer-term trend. One trend we will be monitoring in coming quarters is whether decreased efficiency and rising labor costs negatively impact profit margins.

[/fusion_text][/fusion_builder_column][/fusion_builder_row][/fusion_builder_container]

Housing Market Cools as Interest Rate Increases Impact Economy

Housing Market Cools as Interest Rate Increases Impact Economy

The Covid-19 pandemic profoundly altered the U.S. housing market. Homeowners and renters reevaluated their housing needs and wants as they spent more time at home. At the same time, remote work set off a great migration as employees decided where they wanted to live based on lifestyle rather than employer location. The two themes created a perfect storm of housing demand and overwhelmed homebuilders.

Figure 1 shows the annualized pace of housing starts and building permits steadily climbed after initially plunging during the depths of Covid-19. Housing starts and building permits each jumped to their 2006 highs, levels set during the last housing cycle boom in the lead-up to the 2008 financial crisis. Home and building material prices skyrocketed as housing demand outpaced supply.Mortgage Rates

Recent datapoints indicate the housing market is cooling. Figure 1 shows the pace of housing starts and building permits declined during the first half of 2022, and data recently released by Redfin appears to confirm the slowdown. The real estate brokerage reported ~60,000 home purchase agreements fell through during June, equal to 14.9% of homes that went under contract. Based on Redfin’s analysis, it was the highest percentage on record with the exception of March and April 2020.

The ongoing housing market slowdown indicates the Federal Reserve’s interest rate increases are already impacting the economy. Keep in mind, this is part of the Fed’s plan – ease inflation pressures by reducing demand for goods and services. However, the Fed’s actions are blunt and could start to impact more segments of the economy, such as manufacturing and retail sales. If you have read about rising recession fears, this is one of the catalysts behind the fears. Investors are concerned the Fed is too focused on inflation and will raise interest rates too fast and too high, slamming the brakes on the U.S. economy and starting a recession.