
A Major, Long Term MACD Signal is Forming

For the first time in nearly a year and a half, the US stock market is getting closer and closer to a major buy signal. This signal is based on the QQQ ETF and a changeover in the MACD monthly indicator.
ABOUT THE MACD
While most investors are familiar with the concept of the MACD, as it is a frequently shown indicator and included in most technical charts, it should be noted that using only one indicator can be problematic as no indicator is 100% accurate (I tend to include additional indicators, such as volatility stops).
However, the monthly MACD signal tends to stay on the “right side of the trend” and should not be ignored.
If you are unfamiliar, the MACD (Moving Average Convergence Divergence) is a popular technical analysis indicator and is used to identify potential buy and sell signals in the stock market (it can be used across other financial vehicles, but for this post, I will be using it for equities).
The MACD consists of three components: the MACD line, the signal line, and the histogram.

MACD Line: The MACD line is calculated by subtracting a longer-term Exponential Moving Average (EMA) from a shorter-term EMA. The most commonly used time periods for the EMAs are 12 and 26. The resulting MACD line oscillates above and below a zero line, representing the relationship between the short-term and long-term moving averages.
Signal Line: The signal line is a 9-period EMA of the MACD line. It acts as a trigger line, providing potential buy and sell signals when it crosses above or below the MACD line. Crossovers between the MACD line and the signal line are considered significant indicators of market momentum.
Histogram: The histogram represents the difference between the MACD line and the signal line. It helps visualize the divergence or convergence between the two lines. When the MACD line crosses above the signal line, the histogram bars turn positive, indicating bullish momentum. Conversely, when the MACD line crosses below the signal line, the histogram bars turn negative, suggesting bearish momentum.
There are numerous ways to interpret the MACD:
Bullish Signal: When the MACD line crosses above the signal line and the histogram bars turn positive, it suggests a potential buying opportunity, indicating upward momentum in the market.

Bearish Signal: Conversely, when the MACD line crosses below the signal line and the histogram bars turn negative, it suggests a potential selling opportunity, indicating downward momentum in the market.

Divergence: Divergence occurs when the MACD line and the price of the asset being analyzed move in opposite directions. Bullish divergence is observed when the price makes lower lows while the MACD line makes higher lows, indicating a potential trend reversal. Bearish divergence is observed when the price makes higher highs while the MACD line makes lower highs, suggesting a potential trend reversal.

Convergence: Convergence occurs when the MACD line and the price move in the same direction. It can confirm the strength of an ongoing trend.

While traders and analysts often use the MACD indicator in conjunction with other technical analysis tools, in the analysis below, I will be using only the MACD indicator to examine the long-term signals of the ETF “QQQ”.
WHY USE QQQ?
I am using the QQQ ETF in this analysis due to the makeup of the S&P 500.
The QQQ ETF is primarily composed of technology stocks, including heavy weightings in Microsoft, Apple, Amazon, and Google (Alphabet):

With technology and communication companies making up over 63% of the ETF’s total weighting:

Source: Invesco
If we compare QQQ’s weighting with that of the S&P 500, we will notice the high percentage of weighting towards technology stocks:

Due to the overweight of technology stocks within the S&P 500, we can use the QQQ ETF as a proxy for market signals.
CURRENT AND PAST MACD SIGNALS
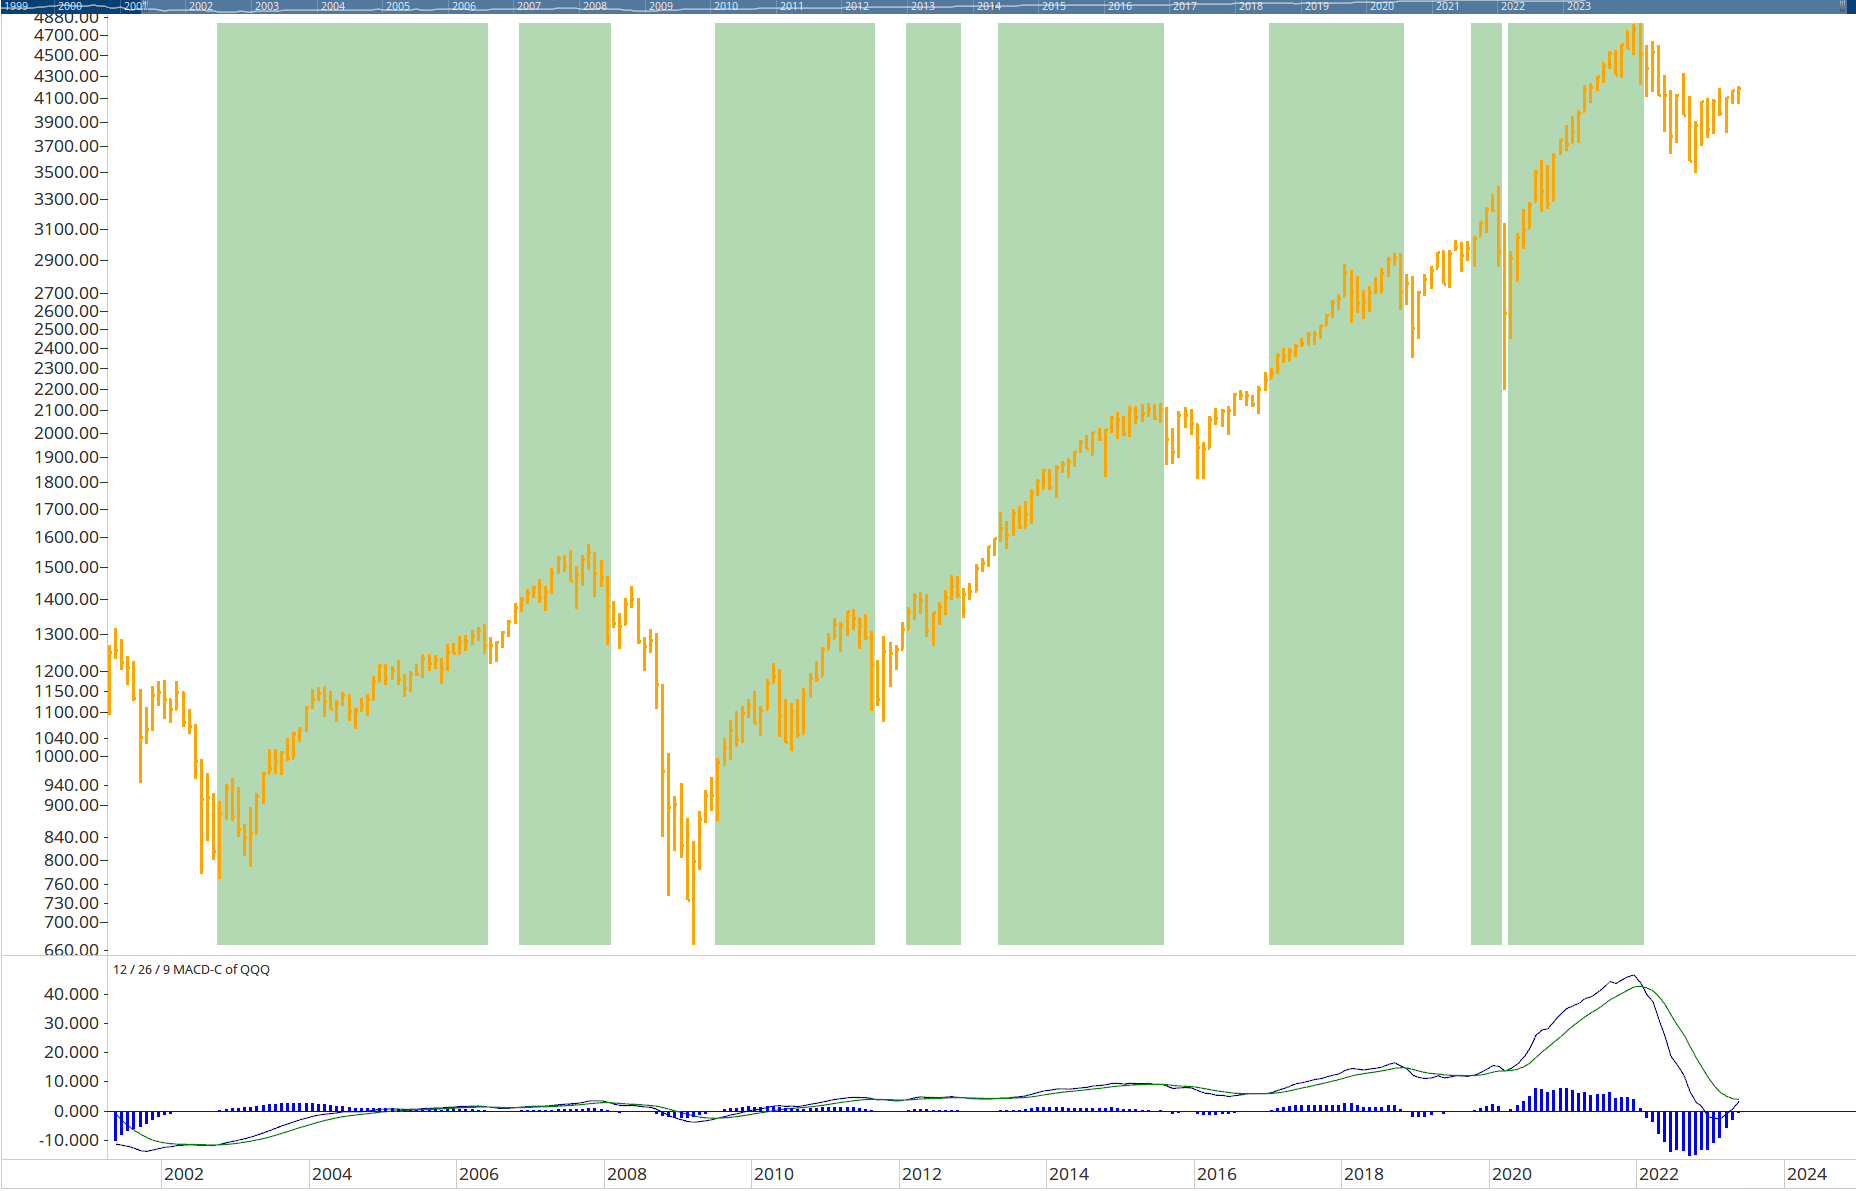
Currently, the monthly MACD indicator is nearing a bullish crossover (a bullish signal) in the QQQ ETF:

Historically a positive, monthly MACD has been a good indication that QQQ will begin/continue an uptrend.
Below I have highlighted in green all the times the MACD histogram has been positive (Monthly QQQ chart):

Below is the S&P 500 when the QQQ MACD histogram has been positive:
Why not just use a monthly MACD crossover with the S&P 500 index itself?
The below chart compares the monthly MACD signal of the S&P 500 vs the monthly MACD signal of the QQQ ETF:
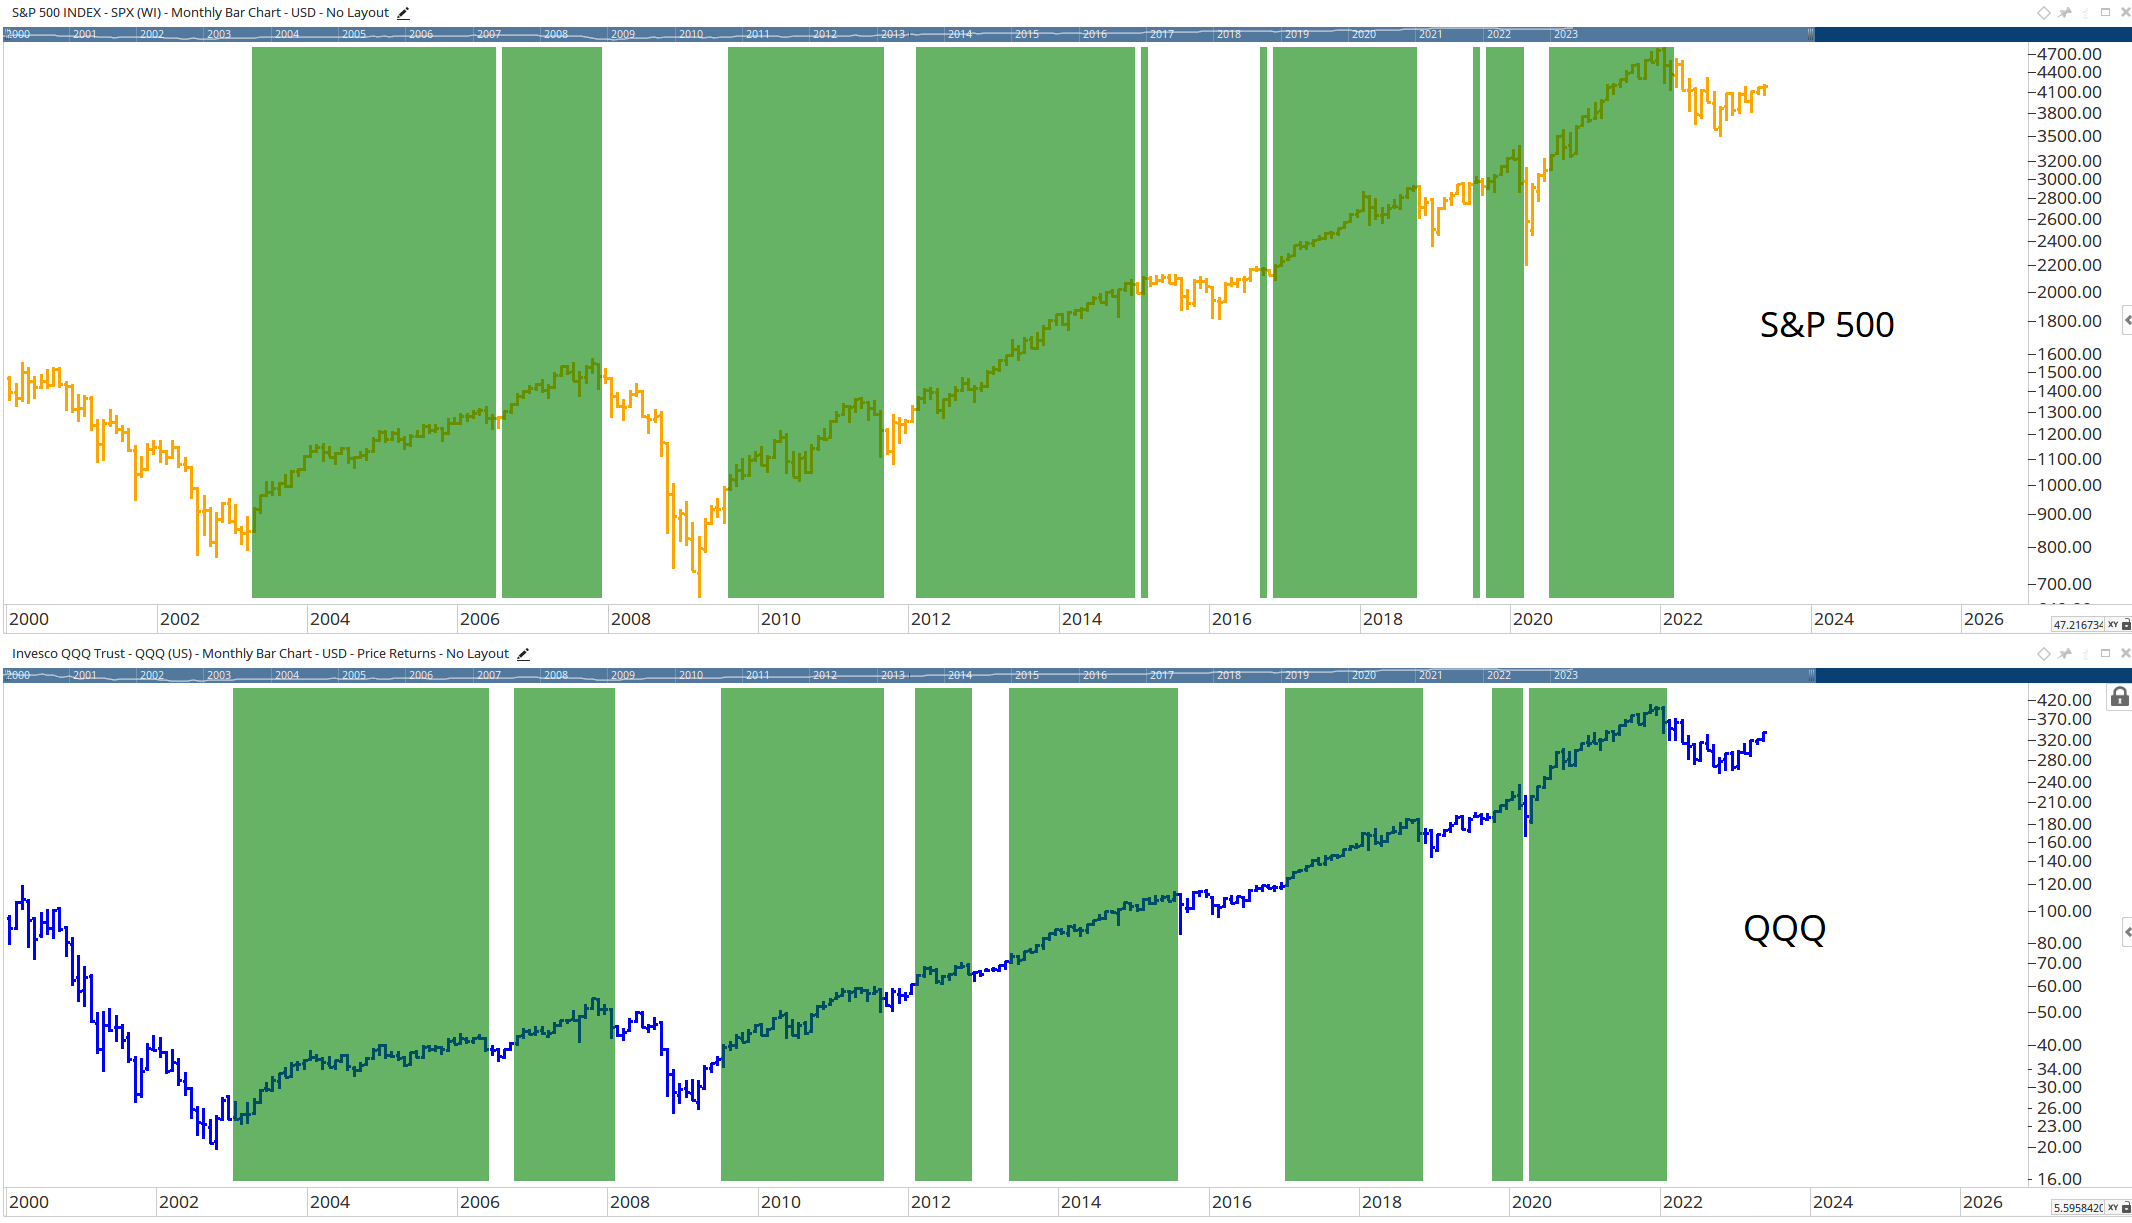
I have found in volatile markets, using QQQ as a proxy for the S&P 500 index tends to provide signals with less whipsaw. (I plan to explore this in much more detail in a future post, as the primary purpose of this post was to highlight a potentially major shift in market sentiment.)
For now, it may be wise to pay attention to this indicator as we approach another monthly bullish crossover.
John Rothe
HAS BEEN FEATURED IN:


© 2023 John Rothe

The opinions expressed on this site are those solely of John Rothe and do not necessarily represent those of Riverbend Investment Management LLC (Riverbend). This website is made available for educational and entertainment purposes only. Mr. Rothe is an Investment Adviser Representative of Riverbend. This website is for informational purposes only and does not constitute a complete description of the investment services or performance of Riverbend. Nothing on this website should be interpreted to state or imply that past results are an indication of future performance. A copy of Riverbend’s Part II of Form ADV and privacy policy is available upon request. This website is in no way a solicitation or an offer to sell securities or investment advisory services. Mr. Rothe and Riverbend Investment Management LLC (Riverbend) disclaim responsibility for updating information. In addition, Mr. Rothe, and Riverbend disclaim responsibility for third-party content, including information accessed through hyperlinks.