While doing my daily chart review, I noticed an interesting change within the S&P 500 taking place.
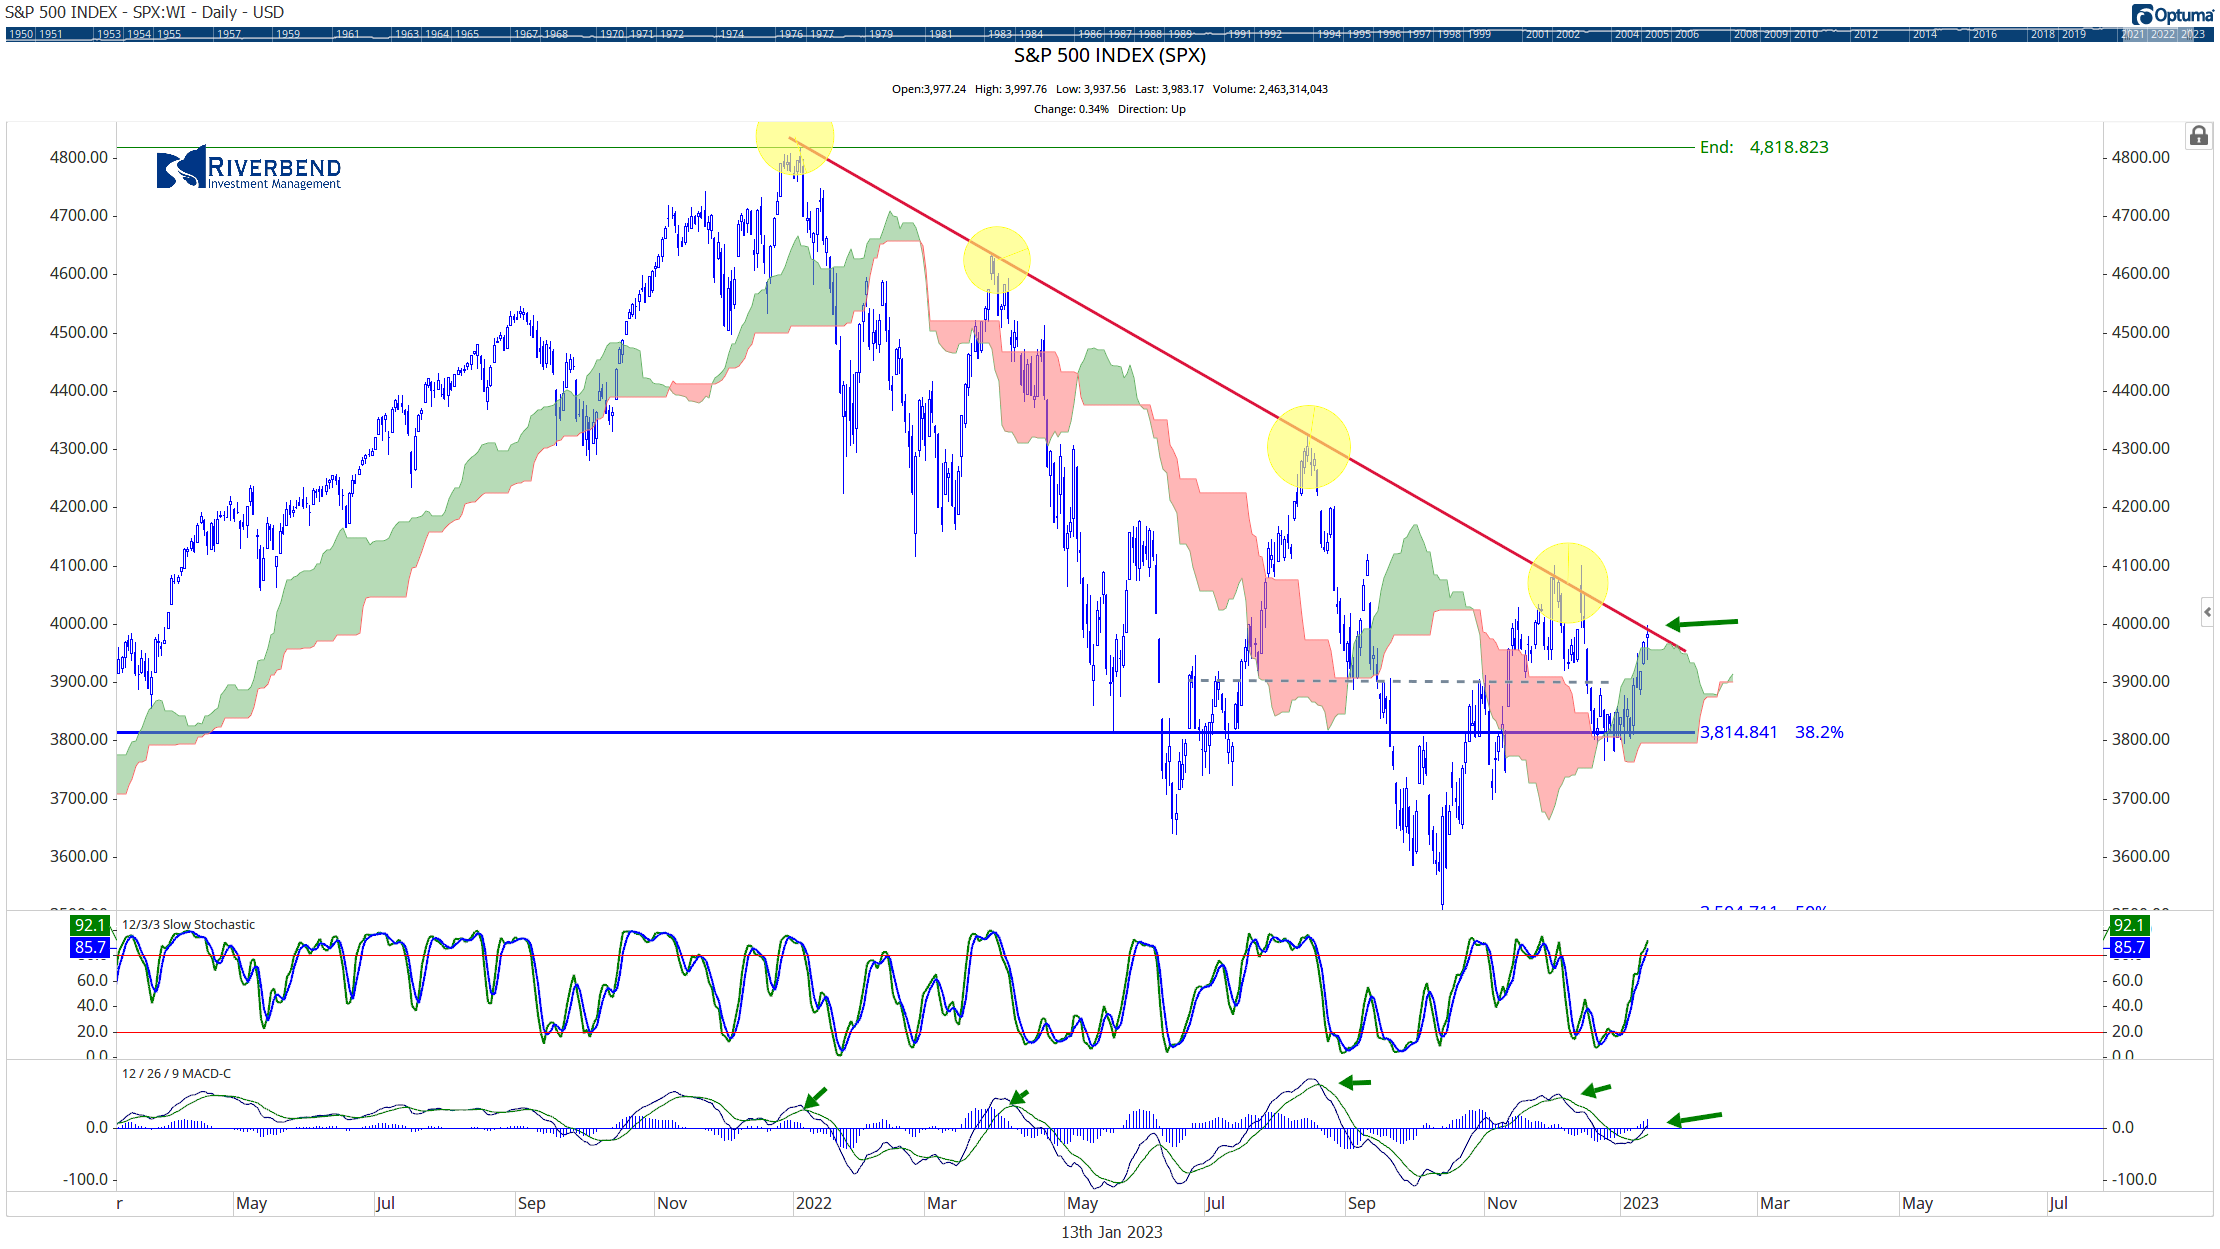
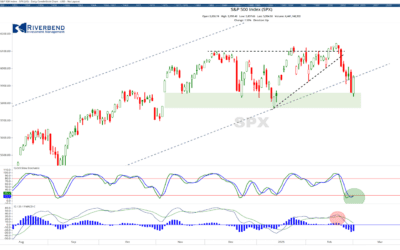
The S&P 500 is clearly still in a downtrend as marked by the red, downward trend line.
But notice the MACD; in the past, the MACD had already formed a buy signal — well before the index “touched” the downward trend line.
This time around, we have a newly formed MACD buy signal as the S&P 500 approaches the trendline.
Is having a not-so-aged MACD buy signal a telling sign that investors are thinking the market will break above the trend? Only time will tell.
For now, it’s just one interesting observation of many.