
Stocks Trade Higher for a Second Consecutive Month

Monthly Market Summary
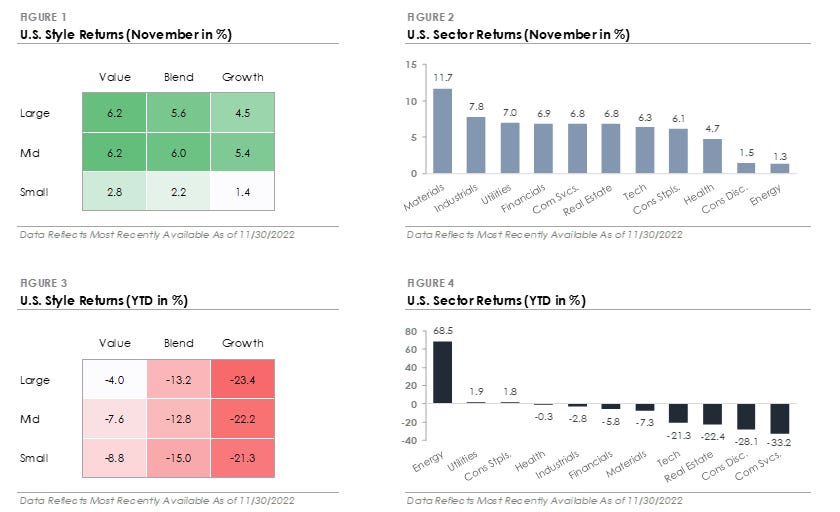
The S&P 500 Index returned +5.6% during November, outperforming the Russell 2000 Index’s +2.2% return.
Cyclical sectors outperformed during November, with Materials (+11.7%) and Industrials (+7.8%), the top two sectors. Energy (+1.3%) was the worst-performing sector as the price of oil declined -6.9%, followed by Consumer Discretionary (+1.5%), which was weighed down by Tesla’s underperformance.
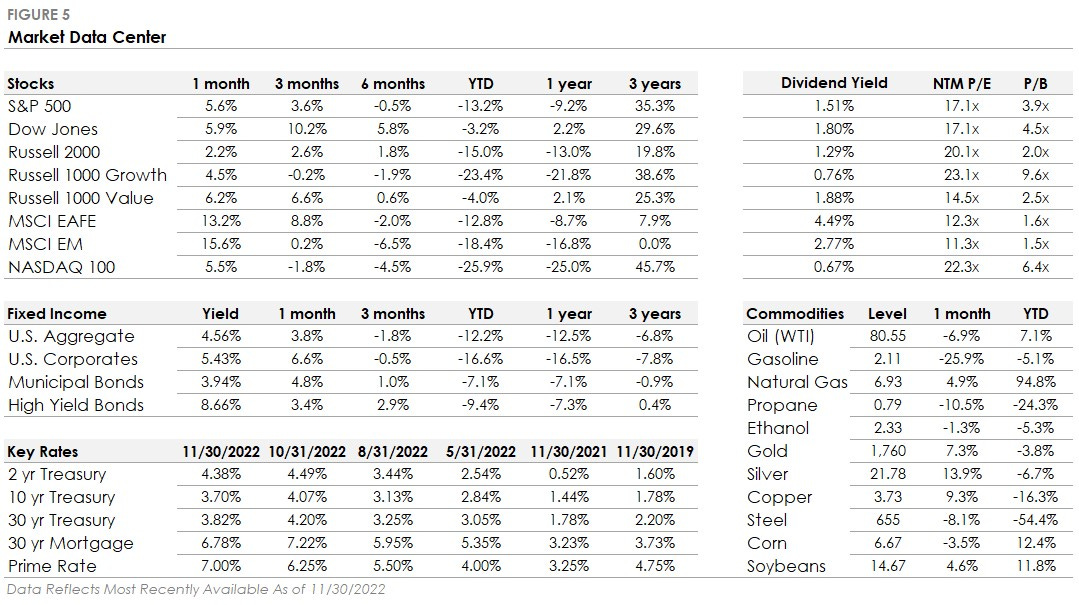
Corporate investment grade bonds generated a +6.6% total return, significantly outperforming corporate high-yield bonds’ +3.4% total return.
The MSCI EAFE Index of global developed market stocks returned +13.2%, underperforming the MSCI Emerging Market Index’s +15.6% return.
Stocks & Bonds Trade Higher After Encouraging October Inflation Report
Stocks traded higher for a second consecutive month after another encouraging inflation report. Data showed the Consumer Price Index (CPI), which measures inflation, increased +0.4% month-over-month during October. While October’s +0.4% reading was a repeat of September’s +0.4%, it was below the market’s +0.6% estimate. Compared to October 2021, the CPI increased by +7.8% year-over-year.
It was the slowest annual pace of inflation since January 2022 and the fourth consecutive month that the pace of inflation slowed from the prior month. Investors cheered the report as fresh evidence that price pressures are easing after a period of high inflation.
The top story in the bond market was falling Treasury yields as investors wagered that a drop in inflation will allow the Federal Reserve to slow its interest rate hikes. Bonds traded higher as interest rates declined, and the U.S. Bond Aggregate generated a +3.8% total return.
The equity market also traded higher, and the S&P 500 followed up October’s +8.1% rally with another +3.6% gain during November. International stocks joined in on the rally and significantly outperformed U.S. equities as the U.S. dollar weakened. Overall, November was a strong month across asset classes.
Market Internals Highlight Broad Participation During November
A look beyond the S&P 500’s headline return reveals strong market breadth. Breadth measures underlying strength or weakness based on the number of stocks advancing or declining and can be used to analyze market trends. A rising index with strong breadth indicates a large group of stocks participated in the index’s rise, while weak breadth indicates fewer stocks participated.
During November, eight out of the eleven S&P 500 sectors outperformed the broad S&P 500 index.
In addition, 425 of the S&P 500’s 503 constituents traded higher during November. This data suggests investors are becoming more confident in the path forward. While it is encouraging to see such broad participation, markets will ultimately be looking for incoming economic data to support the latest rally.