
How to Use Relative Rotation Graphs for Selecting the Best Sectors

Investing in the right sector can be a key determinant of success in the financial markets. However, with numerous sectors and subsectors (let’s not forget about international markets) to choose from, selecting which sectors to allocate in a portfolio can be a bit overwhelming.
Traditional approaches such as fundamental analysis and technical indicators provide valuable insights, but they may not capture the dynamic nature of sector rotation, and if they do it is sometimes well into an already established trend.
During the period between 2000-2010, small-caps outperformed their large-cap counterparts. Looking at a relative strength chart, like the one below, it becomes obvious which area to favor.
However, the problem arises when we try to decide in real-time (instead of hindsight) when the trend begins.

I have found relative rotation graphs (RRG) to be a great tool to help understand sector rotation within a specific market, for example comparing the sectors that make up the S&P 500 index.
RRG charts can provide early insight into which sectors are outperforming a particular index, which sectors are strengthening, and which may become leadership areas to focus on.
This helps to eliminate the problem of deciding when the “trend” begins.
What are Relative Rotation Graphs?
Relative Rotation Graphs (RRGs) are powerful tools that depict the relative strength and momentum of different sectors or asset classes.
Developed by Julius de Kempenaer, RRGs provide a visual representation of how sectors are rotating over time, allowing investors to assess their performance relative to a benchmark index.
Typically sectors will rotate in a clockwise fashion around an index, such as the S&P 500:

The x-axis of an RRG represents the relative strength of a sector, while the y-axis signifies its momentum.
Each sector is represented by a point on the graph, and the direction and curvature of the lines connecting these points indicate the rotation of sectors over time.
How to Use Relative Rotation Graphs (RRG) to Identify Strong Sectors
By analyzing RRGs, investors can determine the most favorable sectors for investment.

Here’s how RRGs can assist in this process:
Visual Representation: RRGs offer a visually intuitive representation of sector rotation. They provide a clear depiction of which sectors are leading, lagging, improving, or weakening over time. This visual representation helps investors identify emerging trends and potential investment opportunities.
Relative Strength Analysis: The x-axis of an RRG measures relative strength, which compares a sector’s performance against a benchmark index. Sectors with a positive slope on the x-axis are outperforming the benchmark, while those with a negative slope are underperforming. Investors can focus on sectors with a positive slope to identify potential investment opportunities.
Momentum Analysis: The y-axis of an RRG measures momentum, which determines the speed and direction of a sector’s price movement. Sectors with a positive slope on the y-axis are exhibiting positive momentum, indicating potential upward price movement.
Rotation Analysis: The direction and curvature of lines connecting the sectors’ points on an RRG indicate their rotation patterns. Sectors moving from the “Weakening” quadrant to the “Leading” quadrant are displaying improving strength and momentum.
Improving Portfolio Performance Using RRGs
In the quest to add alpha, investors are constantly seeking innovative strategies to gain a competitive edge. Relative Rotation Graphs (RRGs) have emerged as a popular tool for analyzing sector rotation dynamics and identifying potential investment opportunities among traders and investors.
So, is there evidence available to show us if RRGs may provide an opportunity to add alpha to a portfolio?
Numerous studies have shown the benefits of using RRGs in portfolio selection:
Enhanced Sector Selection:
One of the primary advantages of utilizing RRGs for investment decisions is the ability to identify sectors with strong relative strength and positive momentum.
By focusing on sectors in the “Leading” quadrant of an RRG, investors can select areas of the market that exhibit robust performance compared to the broader benchmark.
This approach has the potential to improve investment returns by targeting sectors that are on an upward trajectory.
A study conducted by Hsu et al. (2017) examined the effectiveness of RRGs in sector rotation strategies. The research found that RRG-based strategies consistently outperformed buy-and-hold strategies, providing evidence of the enhanced sector selection capabilities of RRGs.
Dynamic Portfolio Management:
RRGs enable investors to adapt their portfolios dynamically based on changing market conditions. By monitoring the rotation of sectors on an RRG, investors can identify when sectors are losing strength or momentum, potentially indicating the need for portfolio adjustments.
This flexibility allows investors to capitalize on emerging opportunities while minimizing exposure to underperforming sectors, enhancing overall portfolio performance.
A research paper by Deshmukh et al. (2019) explored the efficacy of RRGs in managing portfolios. The study demonstrated that RRG-based strategies achieved superior risk-adjusted returns compared to traditional buy-and-hold strategies.
The dynamic nature of RRGs allows for more efficient portfolio management by taking advantage of sector rotation dynamics.
Early Identification of Trends:
RRGs provide a unique advantage by visually displaying the rotation patterns of sectors. By observing sectors transitioning from the “Weakening” quadrant to the “Leading” quadrant, investors can identify sectors that are beginning to exhibit improved strength and momentum.
This early identification of emerging trends allows investors to enter positions at an opportune time, potentially capturing substantial gains as the sector gains momentum.
In a research study by Narang et al. (2020), the authors investigated the performance of RRG-based strategies in capturing trend reversals.
The study found that RRG-based strategies outperformed traditional momentum strategies, demonstrating the effectiveness of RRGs in identifying trends early.
Risk Mitigation:
While RRGs excel in identifying sectors with strong performance, they can also act as risk management tools. By monitoring sectors in the “Lagging” or “Weakening” quadrants, investors can identify areas of the market that are underperforming or losing momentum.
This information can prompt investors to reduce exposure to such sectors, potentially mitigating losses during market downturns or periods of sector-specific weakness.
A study by Chen et al. (2021) investigated the risk management capabilities of RRG-based strategies. The research concluded that incorporating RRG-based signals into portfolio management resulted in improved risk-adjusted returns and reduced downside risk.
Testing Relative Rotation Graphs (RRG)
To further test the results of using an RRG strategy, I compared the sectors of the S&P 500 vs the index itself to see if there are any alpha-generating benefits. (I am only showing a few tests, as a much more in-depth paper will be published in the future).
All tests are using 1/1/2000 – 12/31/2022 as the time frame. The test examines returns 21 days before the signal to 120 days post-signal using OPTUMA’s signal tester.
Buy sectors when they enter the ‘improving’ quadrant:
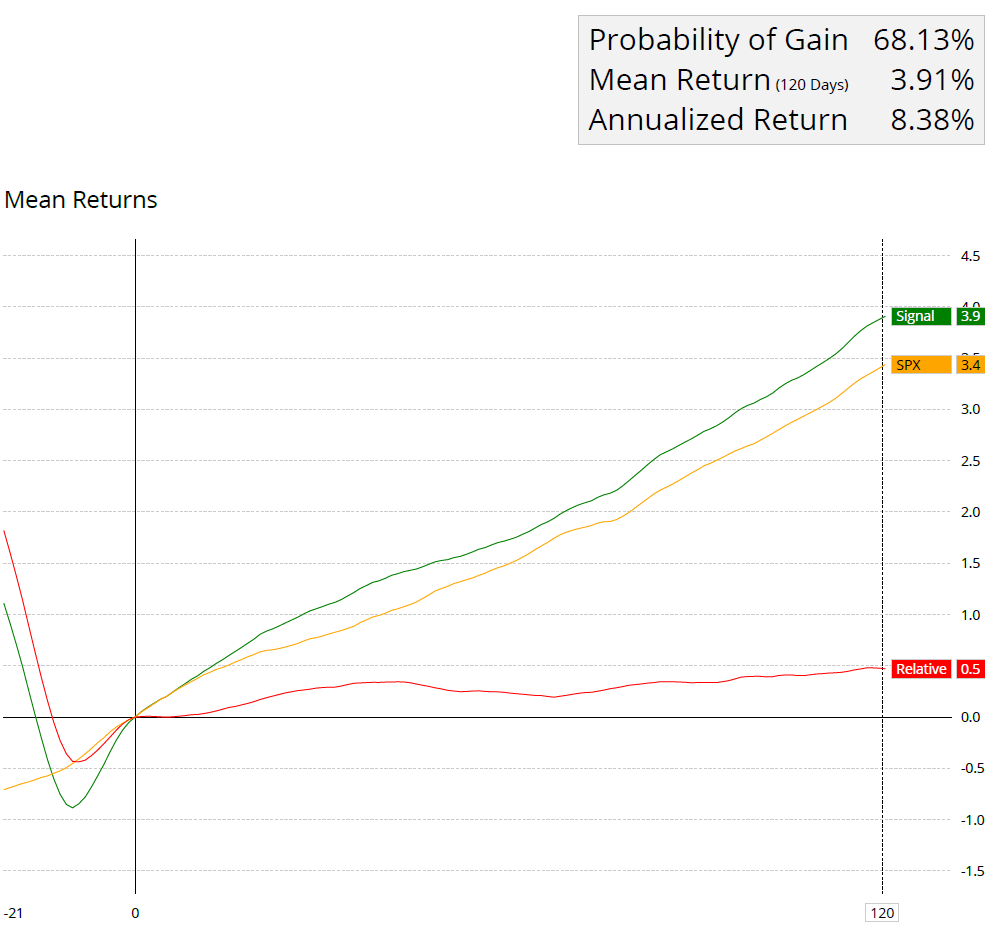
Source: Optuma
Buy sectors when they enter the ‘improving’ quadrant and if the distance from the center point is greater than 2.
Sectors with a larger distance value will appear further from the center of an RRG chart. One of the observations is that higher alpha comes from those that make bigger arcs, the distance measure allows us to quantify that. (OPTUMA)
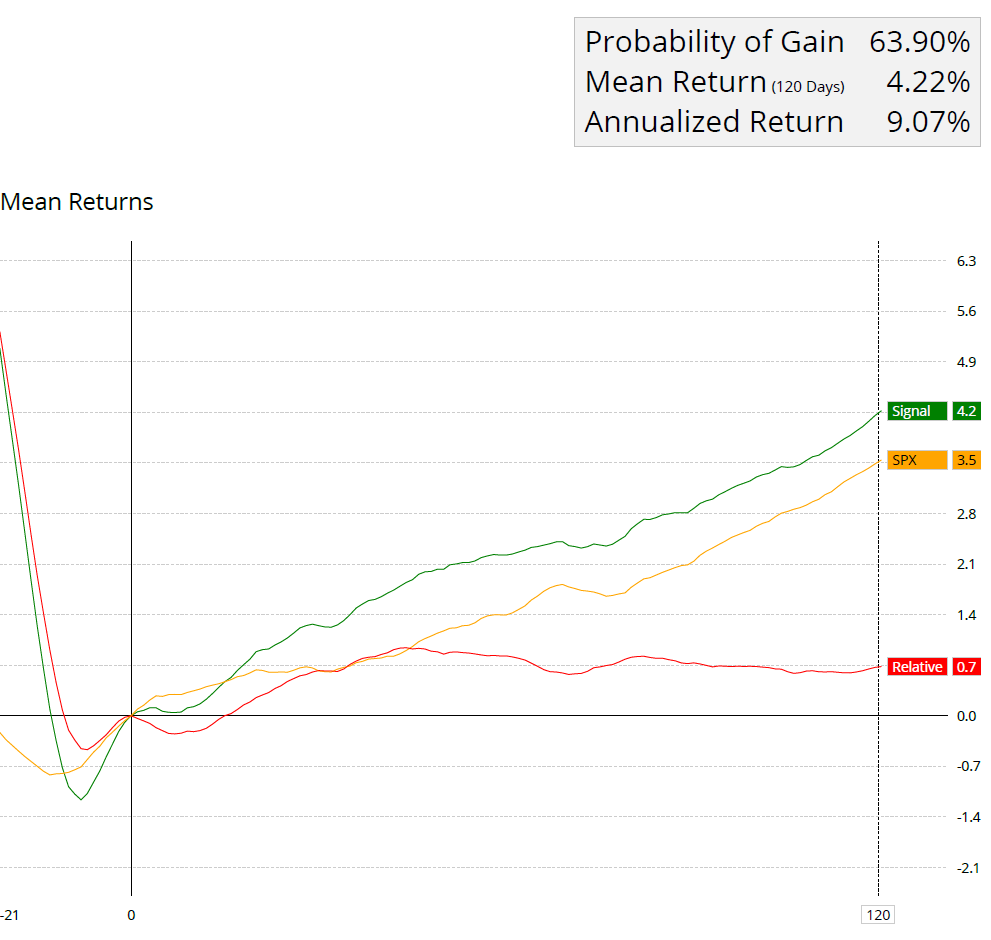
Source: Optuma
Relative rotation graphs can also be used on individual names within the S&P 500 index (using historical index data provided by Optuma).
Buy stock when they enter the ‘improving’ quadrant and if the distance from the center point is greater than 2.
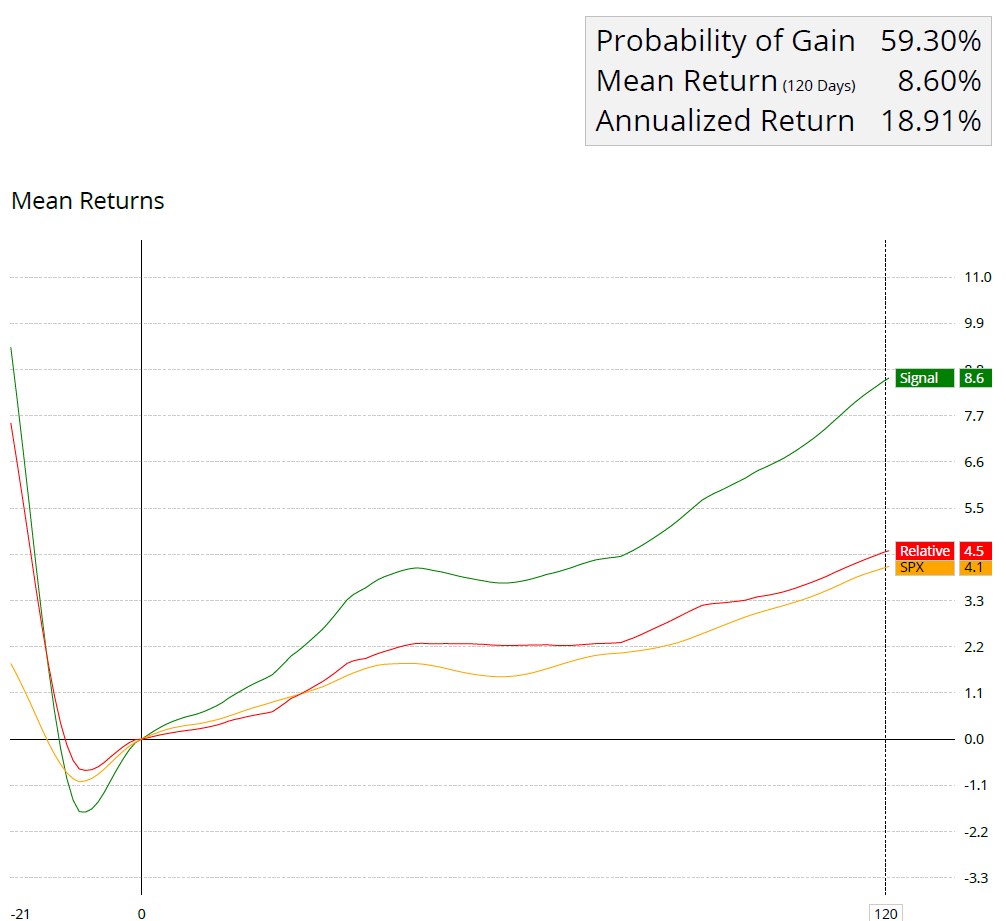
Source: Optuma
Matthew Verdouw, CMT, CFTe published a thorough whitepaper on relative rotation graphs.
(You can read it here: https://www.optuma.com/wp-content/uploads/2023/02/buying-out-performers-is-too-late.pdf)
In his whitepaper, Mr. Verdouw examined which quadrants provided the best opportunities. His research shows that the best performance comes from equities entering the lagging quadrant.
Immediately we can see that historically, equities entering the Lagging quadrant—where they have negative relative trend—have the highest returns.
They also offer the largest Annual Return is measured by taking the returns over the 30 day period and extrapolating to a year.
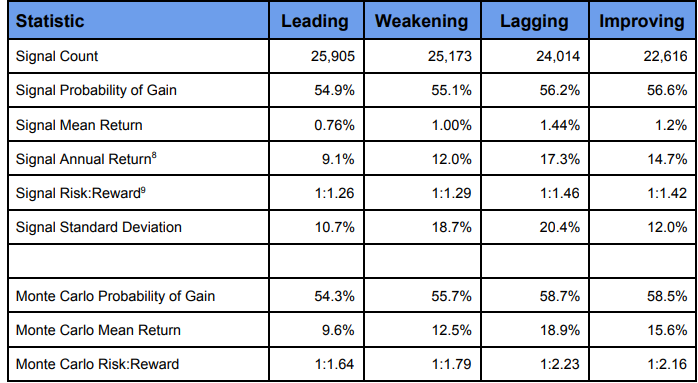
source: Buying Outperformers is Too Late
Combining relative rotation graphs with other indicators (combining RRGs with volatility stops is a personal favorite), may provide investors an opportunity to enhance returns, as well as using other benchmarks – such as short-term treasuries.
The utilization of Relative Rotation Graphs (RRGs) in investment decision-making has proven to be a valuable approach for identifying sectors with strong relative strength and positive momentum.
Empirical studies provide compelling evidence of the performance of Relative Rotation Graphs (RRGs) in investment decision-making.
The findings indicate the ability of RRG-based strategies to outperform traditional buy-and-hold approaches, enhance sector selection, identify trends early, and assist in risk management.
Sources:
Hsu, J., Lin, T., & Chen, S. (2017). Relative Rotation Graphs: A Systematic Approach for Sector Rotation Strategies. Journal of Applied Finance & Banking, 7(4), 129-144.
Deshmukh, A., Jain, P., & Krishnamurti, C. (2019). Using Relative Rotation Graphs (RRGs) to Build Investment Portfolios. Journal of Behavioral Finance, 20(4), 424-442.
Narang, S., Sirjuesingh, M., & Kapoor, K. (2020). Sector Rotation using Relative Rotation Graphs. International Journal of Business and Globalisation, 25(2), 252-266.
Chen, S., Hsu, J., & Chen, Y. (2021). Relative Rotation Graphs and Risk Management in Sector Rotation Strategies. International Journal of Financial Research, 12(4), 258-272.
Verdouw, Matthew (2016). Buying Outperformers is Too Late. https://www.optuma.com/research/
De Kempenaer, Julius. “Sector Rotation with RRGs.” Relative Rotation Graphs, https://www.relativerotationgraphs.com/.
Minervini, Mark. “Relative Rotation Graphs (RRG) For Relative Strength Analysis.” StockCharts.com, https://stockcharts.com/articles/chartwatchers/2014/07/relative-rotation-graphs-rrg-for-relative-strength-analysis.html.
Katsanos, Markos. “Relative Rotation Graphs (RRG).” Quantitative Technical Analysis, https://www.quantitativeanalysis.eu/articles/relative-rotation-graphs-rrg.
John Rothe
HAS BEEN FEATURED IN:


© 2023 John Rothe

The opinions expressed on this site are those solely of John Rothe and do not necessarily represent those of Riverbend Investment Management LLC (Riverbend). This website is made available for educational and entertainment purposes only. Mr. Rothe is an Investment Adviser Representative of Riverbend. This website is for informational purposes only and does not constitute a complete description of the investment services or performance of Riverbend. Nothing on this website should be interpreted to state or imply that past results are an indication of future performance. A copy of Riverbend’s Part II of Form ADV and privacy policy is available upon request. This website is in no way a solicitation or an offer to sell securities or investment advisory services. Mr. Rothe and Riverbend Investment Management LLC (Riverbend) disclaim responsibility for updating information. In addition, Mr. Rothe, and Riverbend disclaim responsibility for third-party content, including information accessed through hyperlinks.