Understanding Fibonacci Retracement Levels
Understanding Fibonacci Retracement Levels
Technical analysis remains a widely used method for forecasting the future price movements of financial assets. Among its myriad tools and techniques, the concept of Fibonacci Retracement levels stands out due to its historical significance and ubiquitous application.
Historical Origins
The inception of the Fibonacci sequence can be traced back to Leonardo of Pisa, an Italian mathematician from the 13th century, popularly known as Fibonacci.
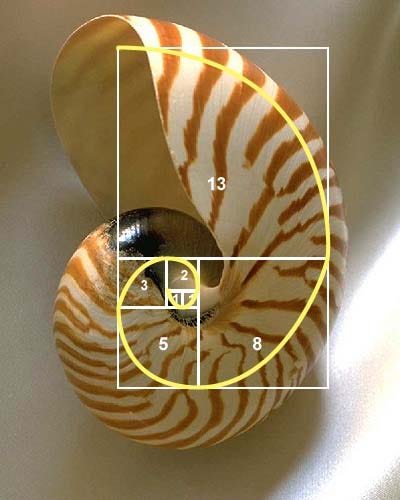
In his book, Liber Abaci, he introduced a sequence of numbers to the Western world that later came to be known as the Fibonacci sequence. It begins as 0, 1, 1, 2, 3, 5, 8, 13, and so on. Each number is the sum of the preceding two.

Source: Math Images
Interestingly, this sequence isn’t just a numerical marvel; it manifests in various natural phenomena, including the arrangement of leaves on plants, the spiral of galaxies, and even the proportioning of features in human faces.
Translating Fibonacci to Financial Markets
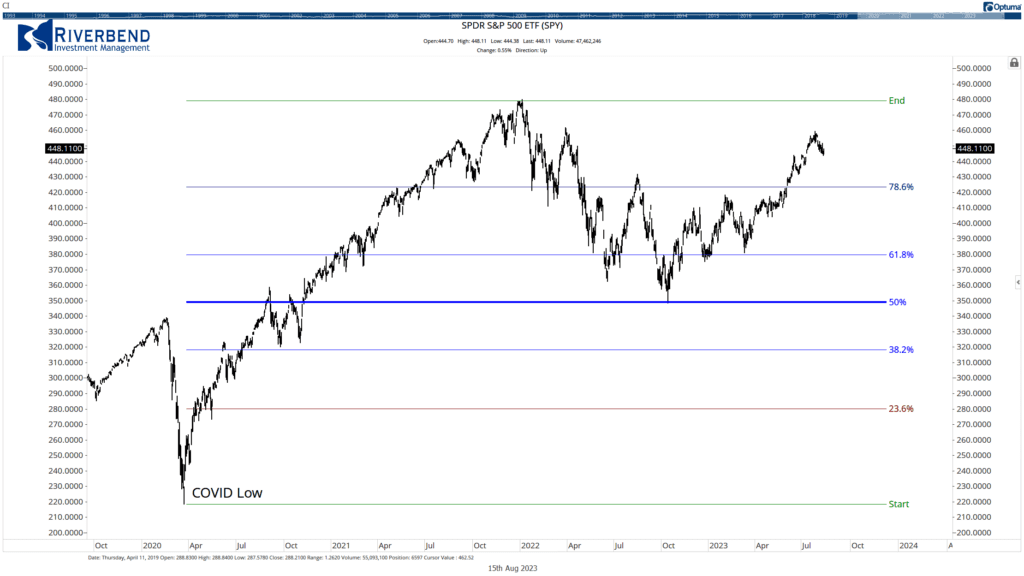
In technical analysis, Fibonacci retracement levels are horizontal lines that indicate potential support or resistance levels. These levels are calculated by taking the difference between a major peak and trough and multiplying this distance by the key Fibonacci ratios, which are 23.6%, 38.2%, 50%, 61.8%, and 78.6%.

The Decline in the S&P 500 during 2022, stopped at its 50% retracement level from the COVID lows of 2020
For instance, if a stock price climbs from $10 to $20, then retraces to $15, it has retraced 50% of its move. Fibonacci retracement levels would plot potential support or resistance at a few distinct percentages of that move.
Applications in Trading
Identifying Support and Resistance: Traders employ these levels to identify potential price zones where an asset might reverse direction. For instance, if the price of an asset starts declining after a rise, it might find support at one of the Fibonacci levels.
Setting Stop-Loss and Take-Profit Points: Knowing potential reversal areas allows traders to set logical stop-loss or take-profit points, minimizing the emotional aspect of trading.
Combining with Other Tools: The accuracy of Fibonacci retracements increases when combined with other indicators like moving averages, RSI, or candlestick patterns.
Practical Implications
No Guarantees: Like all trading tools, Fibonacci retracements do not guarantee success. They provide a framework, but market psychology and external news can often drive prices.
More is Better: A principle that many traders follow is that the more the price respects a certain Fibonacci level in the past, the more likely it is to have significance in the future.
Depth of Retracement: While the 50% level isn’t a “true” Fibonacci number, it’s often included because assets frequently retrace about half of a significant move before resuming their trend.
Criticisms
Despite their popularity, Fibonacci retracement levels aren’t without detractors. Critics argue that:
Self-fulfilling Prophecy: The levels might work because many traders use them, not necessarily because they have any inherent predictive power.
Ambiguity: In trending markets, pinpointing the ‘right’ high and low for drawing retracements can be subjective.
Over-reliance: Solely depending on Fibonacci retracements without considering other market factors can lead to flawed decision-making.

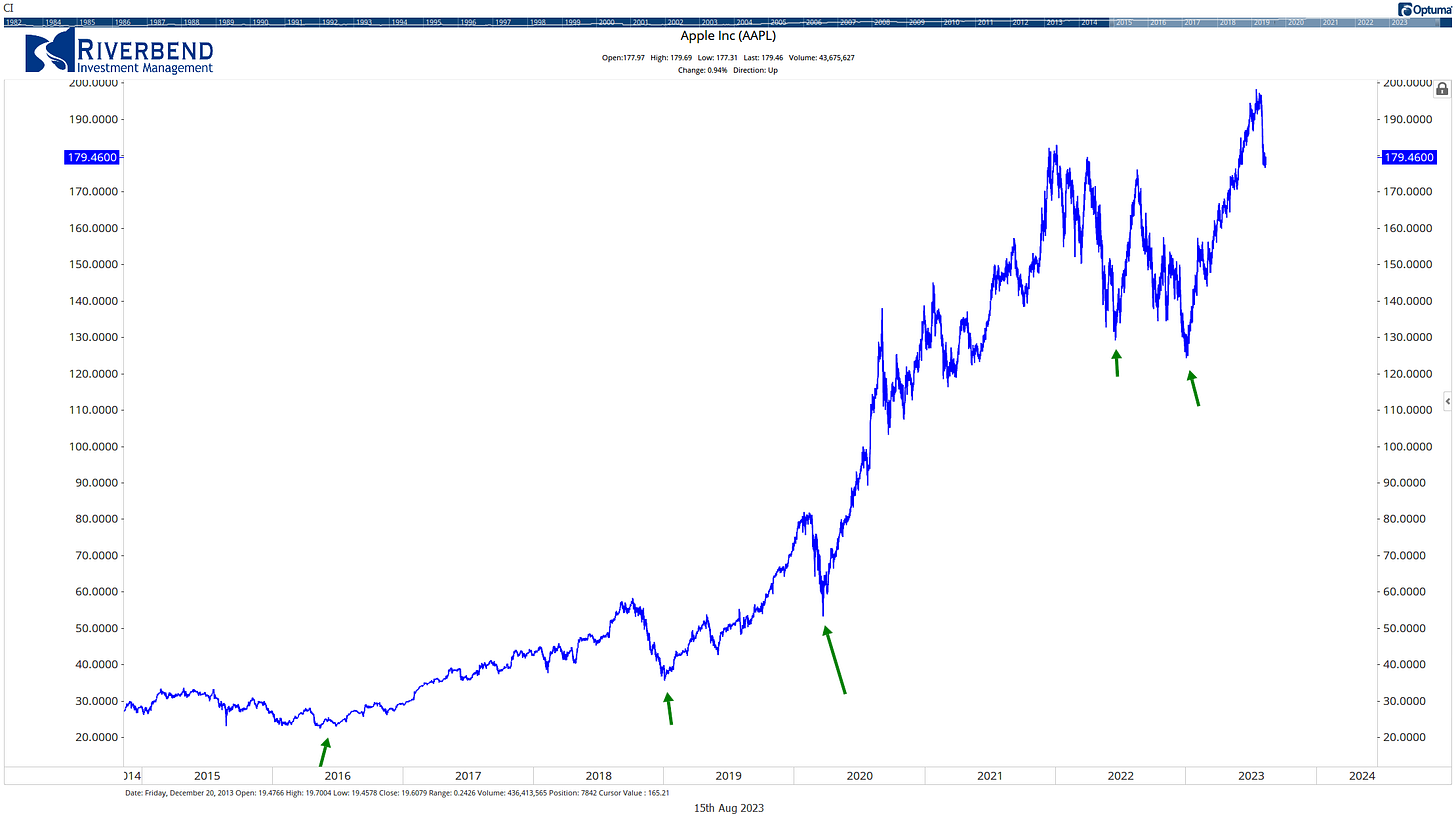
Different technicians may use different starting points in their analysis
The allure of the Fibonacci sequence and its relevance in nature inevitably piques curiosity when it’s applied to financial markets. However, the key is understanding that Fibonacci retracement levels, while useful, are just one of many tools in a trader’s toolkit. They are best used in conjunction with a comprehensive trading strategy and a disciplined approach.
Sources:
Fibonacci, L. (1202). Liber Abaci.
Kirkpatrick, C. D., & Dahlquist, J. (2010). Technical Analysis: The Complete Resource for Financial Market Technicians. FT Press.
Pring, M. J. (2002). Technical Analysis Explained: The Successful Investor’s Guide to Spotting Investment Trends and Turning Points. McGraw Hill Professional.

