What is Stagflation?
Stagflation refers to the rare combination of high inflation, slow economic growth, and high unemployment. In a typical business cycle, inflation rises during periods of strong growth and falls during recessions when unemployment spikes. But in the 1970s, the U.S. experienced the worst of both worlds – soaring prices coupled with a stagnant economy and rising joblessness.
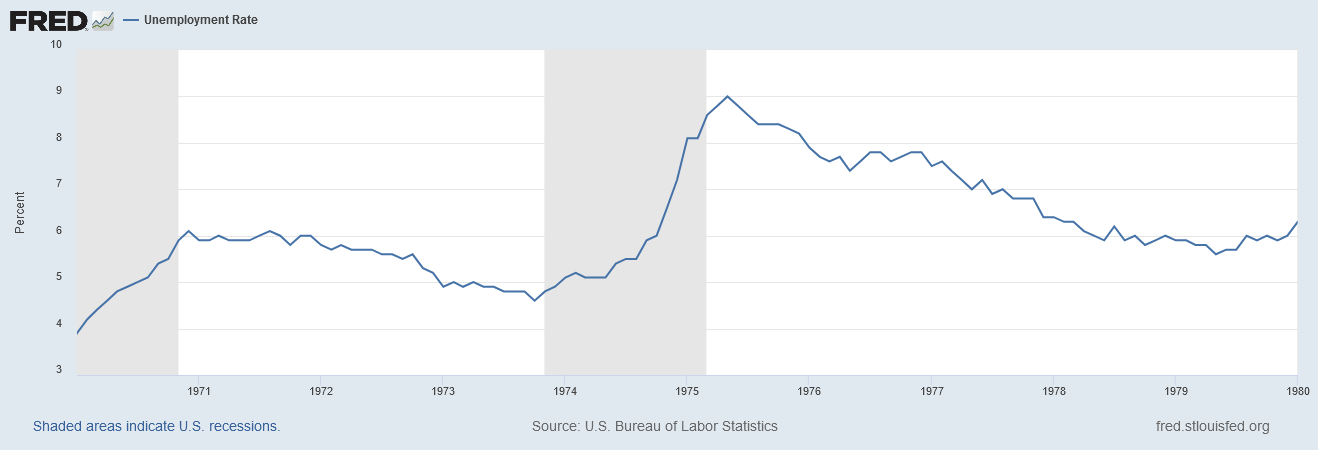
The unemployment rate significantly rose during the mid 1970’s:
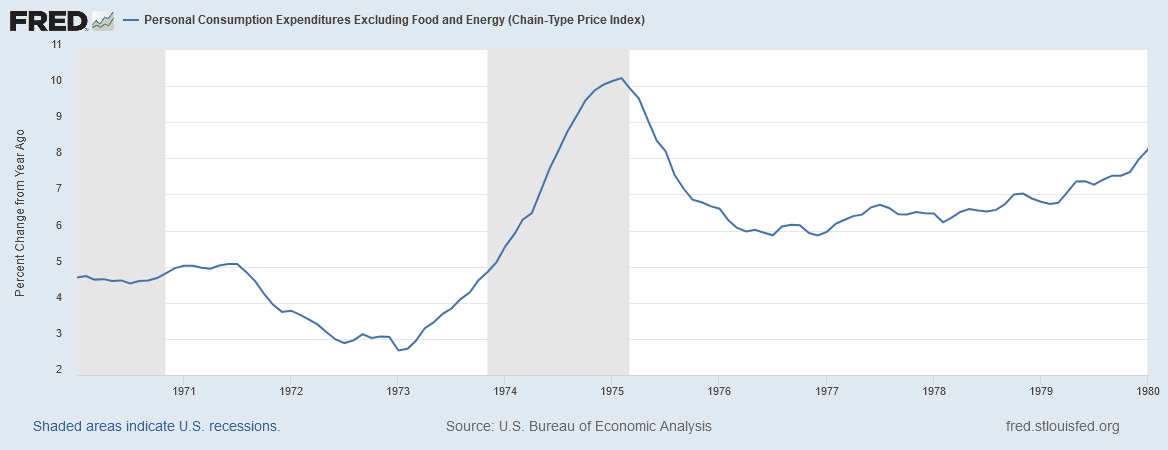
While inflation data rapidly rose as well:
Several factors fueled the stagflationary environment:
– Excessive government spending on the Vietnam War and social programs
– Easy monetary policy and the end of the gold standard in 1971
– Oil price shocks in 1973 and 1979 engineered by OPEC
– Declining productivity growth
Inflation peaked at over 14% in 1980. The unemployment rate reached nearly 11% in the 1981-82 recession. And real GDP growth averaged a meager 3.2% for the decade, well below the 4.3% pace of the 1960s.
Stock Market Performance During Stagflation
Overall, the 1970s was a lost decade for stock investors. The S&P 500 eked out nominal gains of just 17% for the 10-year period, far below the rate of inflation. In real (inflation-adjusted) terms, the S&P 500 lost nearly 50% of its value during the 1970s.
The Dow Jones Industrial Average opened the decade at 809 and closed 1979 at just 839, almost no gain. Steep bear markets in 1973-74 and 1977 took a heavy toll. Corporate earnings grew at a 9% annual clip in the 70s, but the price-to-earnings multiple investors were willing to pay for those profits was cut in half by the end of the decade.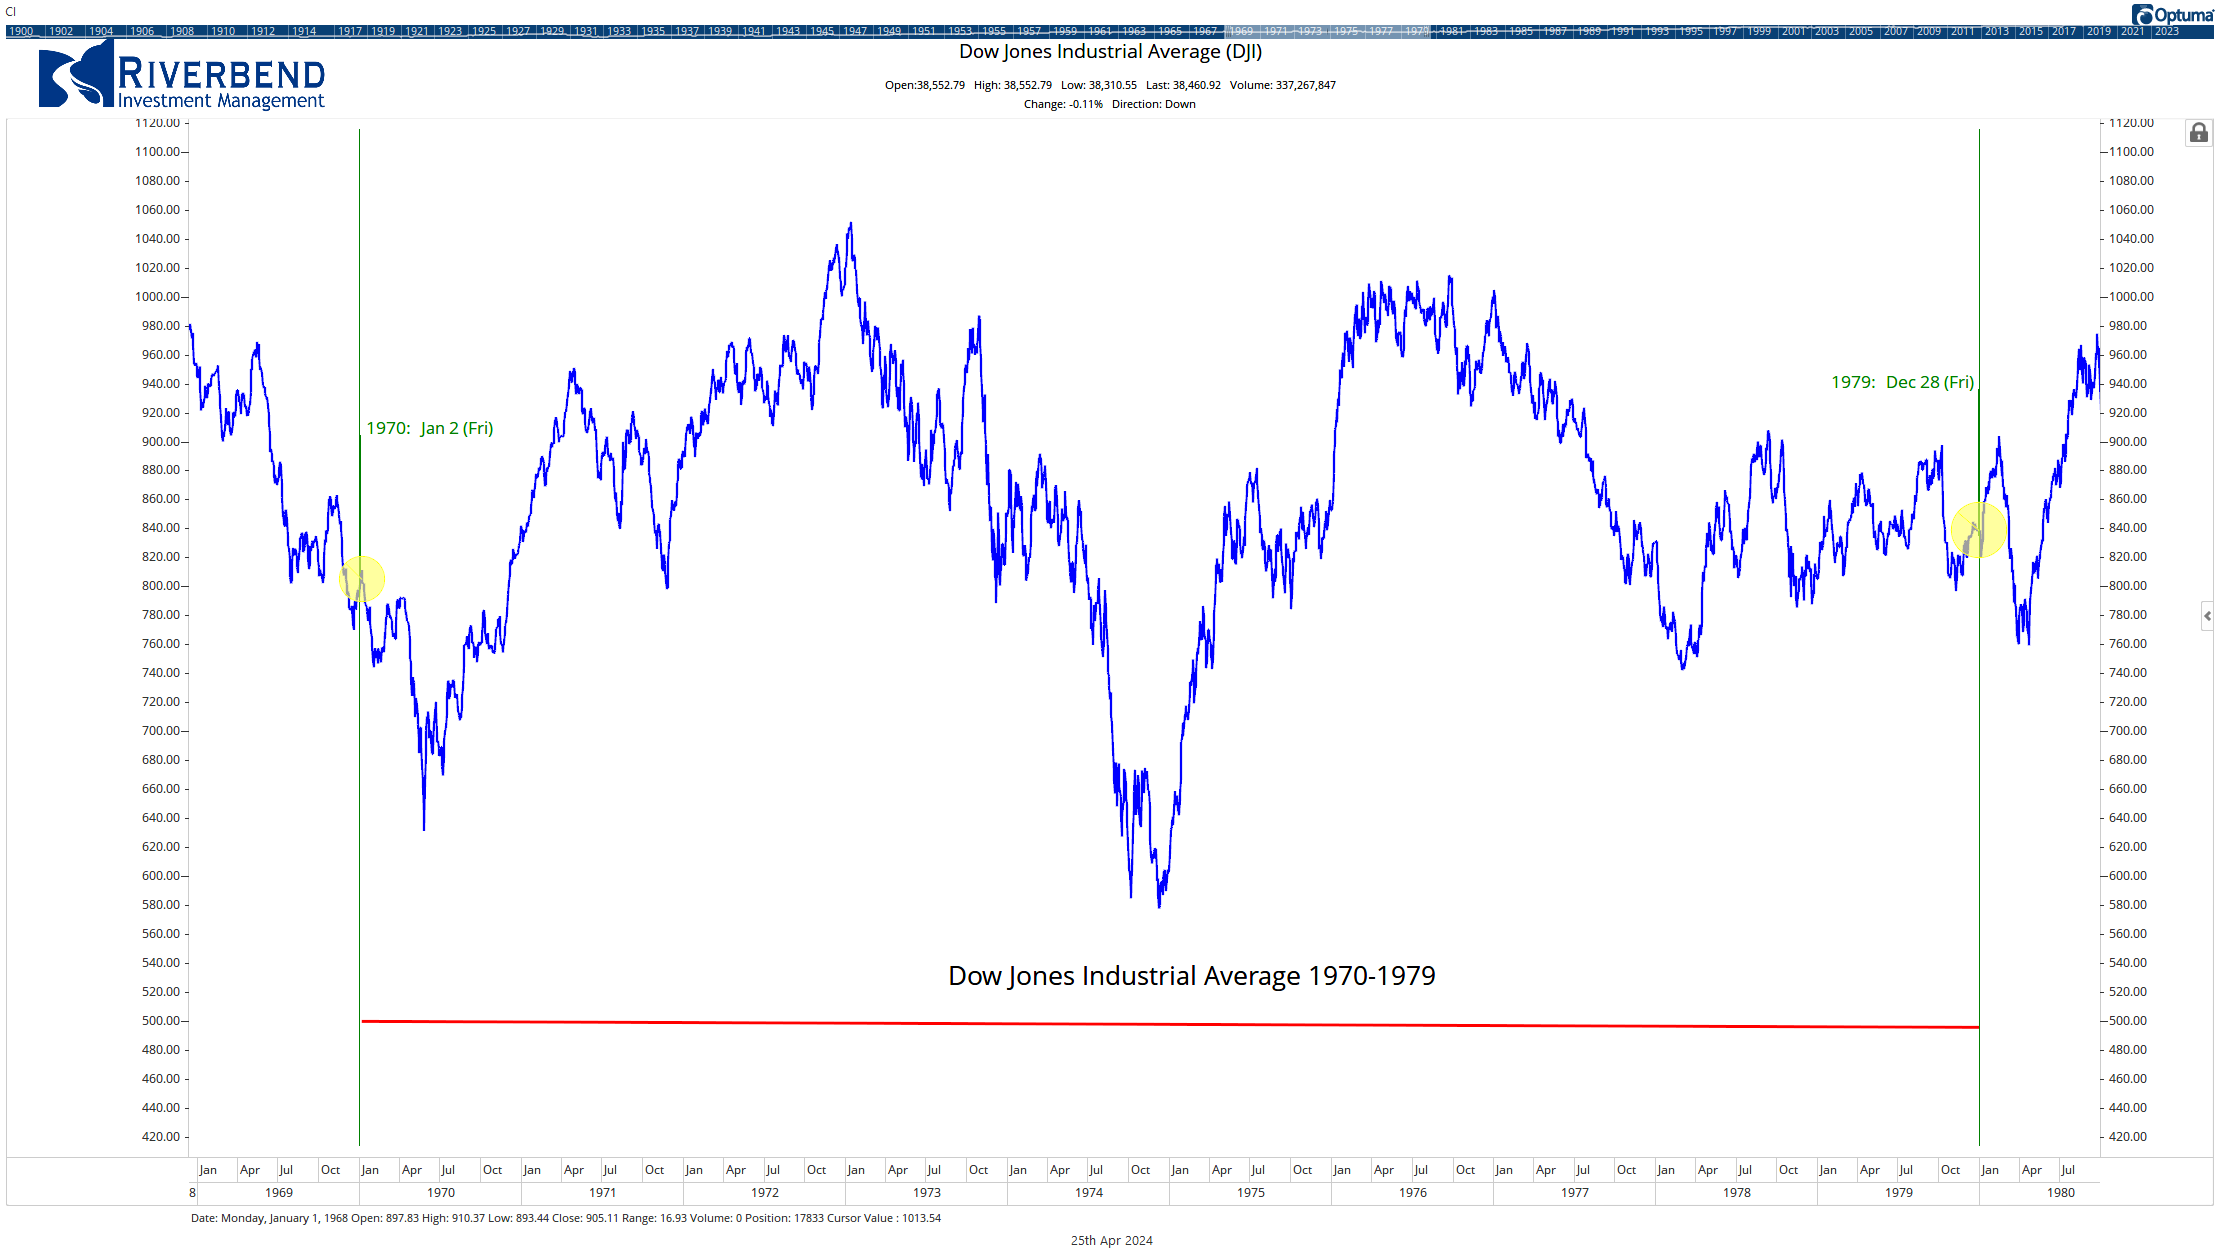
However, some sectors and investment classes did manage to outperform in the stagflationary environment:
Energy Stocks
With oil prices spiking over 1000% from $3 per barrel to $40 during the decade, energy was by far the best-performing stock market sector. Oil & gas companies saw earnings soar. Exxon, for example, grew profits at a 17% annual rate in the 1970s.
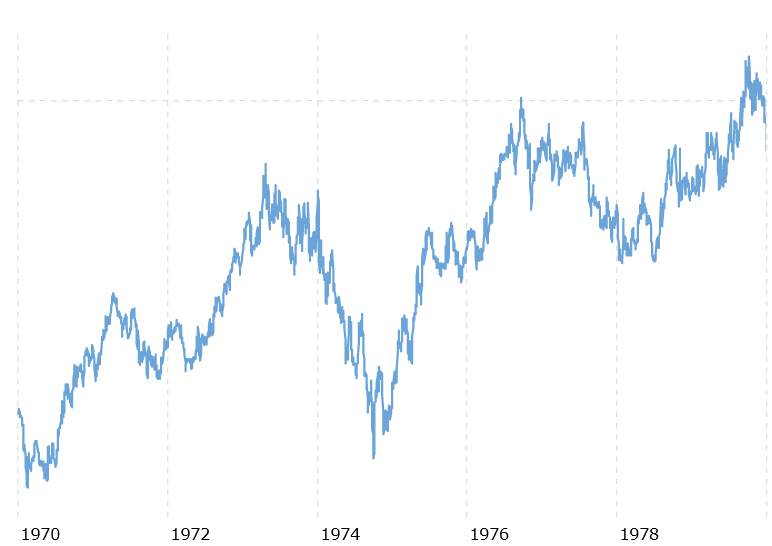 Exxon 1970-1979. Source: Macrotrends
Precious Metals and Mining
Gold was the single best-performing asset class of the 1970s, rising from $35 an ounce to over $800, a 2200% gain. Silver and other precious metals also posted huge returns as investors sought inflation hedges.
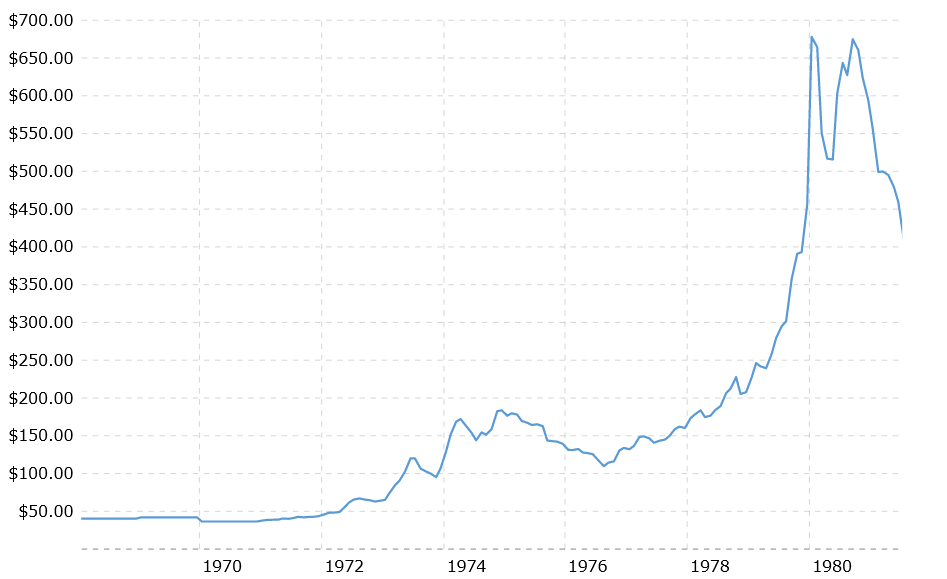
The Price of Gold Soared During the 1970s. Source: Macrotrends
Gold mining stocks posted huge returns during this time. Companies involved in gold, silver, and copper extraction saw their valuations rise dramatically.
Real Estate
Real estate investment trusts (REITs) and direct property ownership provided a partial inflation hedge, with rental prices and property values rising along with the general price level. Farmland values rose at a 14% annual rate. Residential real estate was more of a mixed bag, with some regions like California seeing huge gains while others stagnated under rent controls.
Commodities
Besides precious metals, a wide range of commodities posted big gains in the 1970s:
– Oil prices rose over 1000%
– Agricultural goods like wheat, corn and soybeans more than tripled
– Lumber prices increased fivefold
– Copper and other industrial metals also saw large gains[
Value Stocks & Defensive Sectors
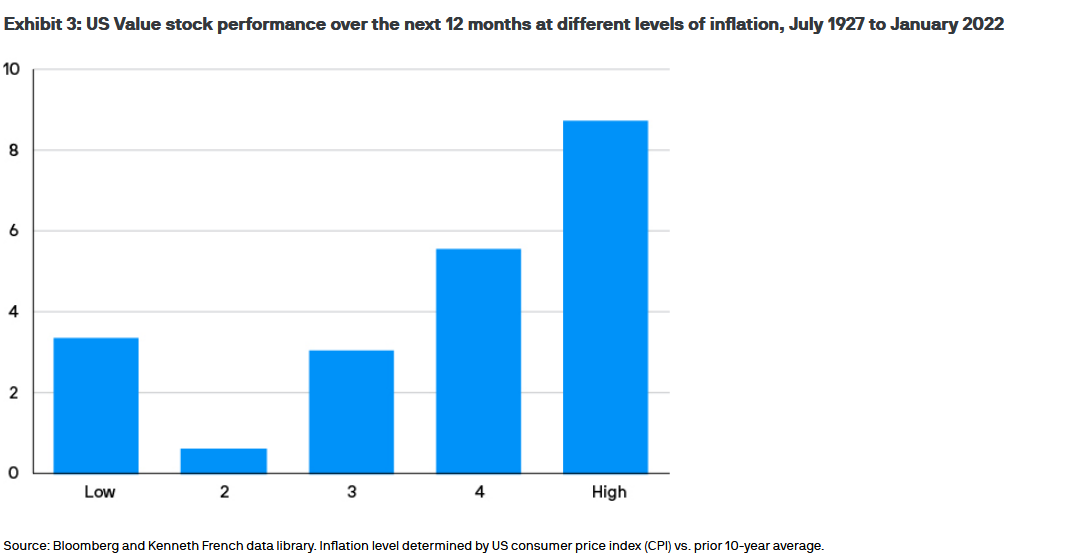 Source: JPMorgan
Among equities, cheaper-value stocks outperformed higher-priced growth stocks. Defensive sectors like consumer staples, healthcare, and utilities held up better than economically-sensitive areas like autos, steel, and housing. Blue-chip dividend payers were favored for their income in an era of paltry stock market gains.
Consumer staples stocks like General Foods (which later became Kraft and then Mondelez and Kraft Heinz) held up better than the broader market. Defensive sectors like consumer staples, healthcare and utilities outperformed as investors favored companies with pricing power that could maintain profit margins even with high inflation
Losers of the 1970s
While commodities and hard assets thrived, financial assets broadly struggled during the stagflationary 70s:
Bonds
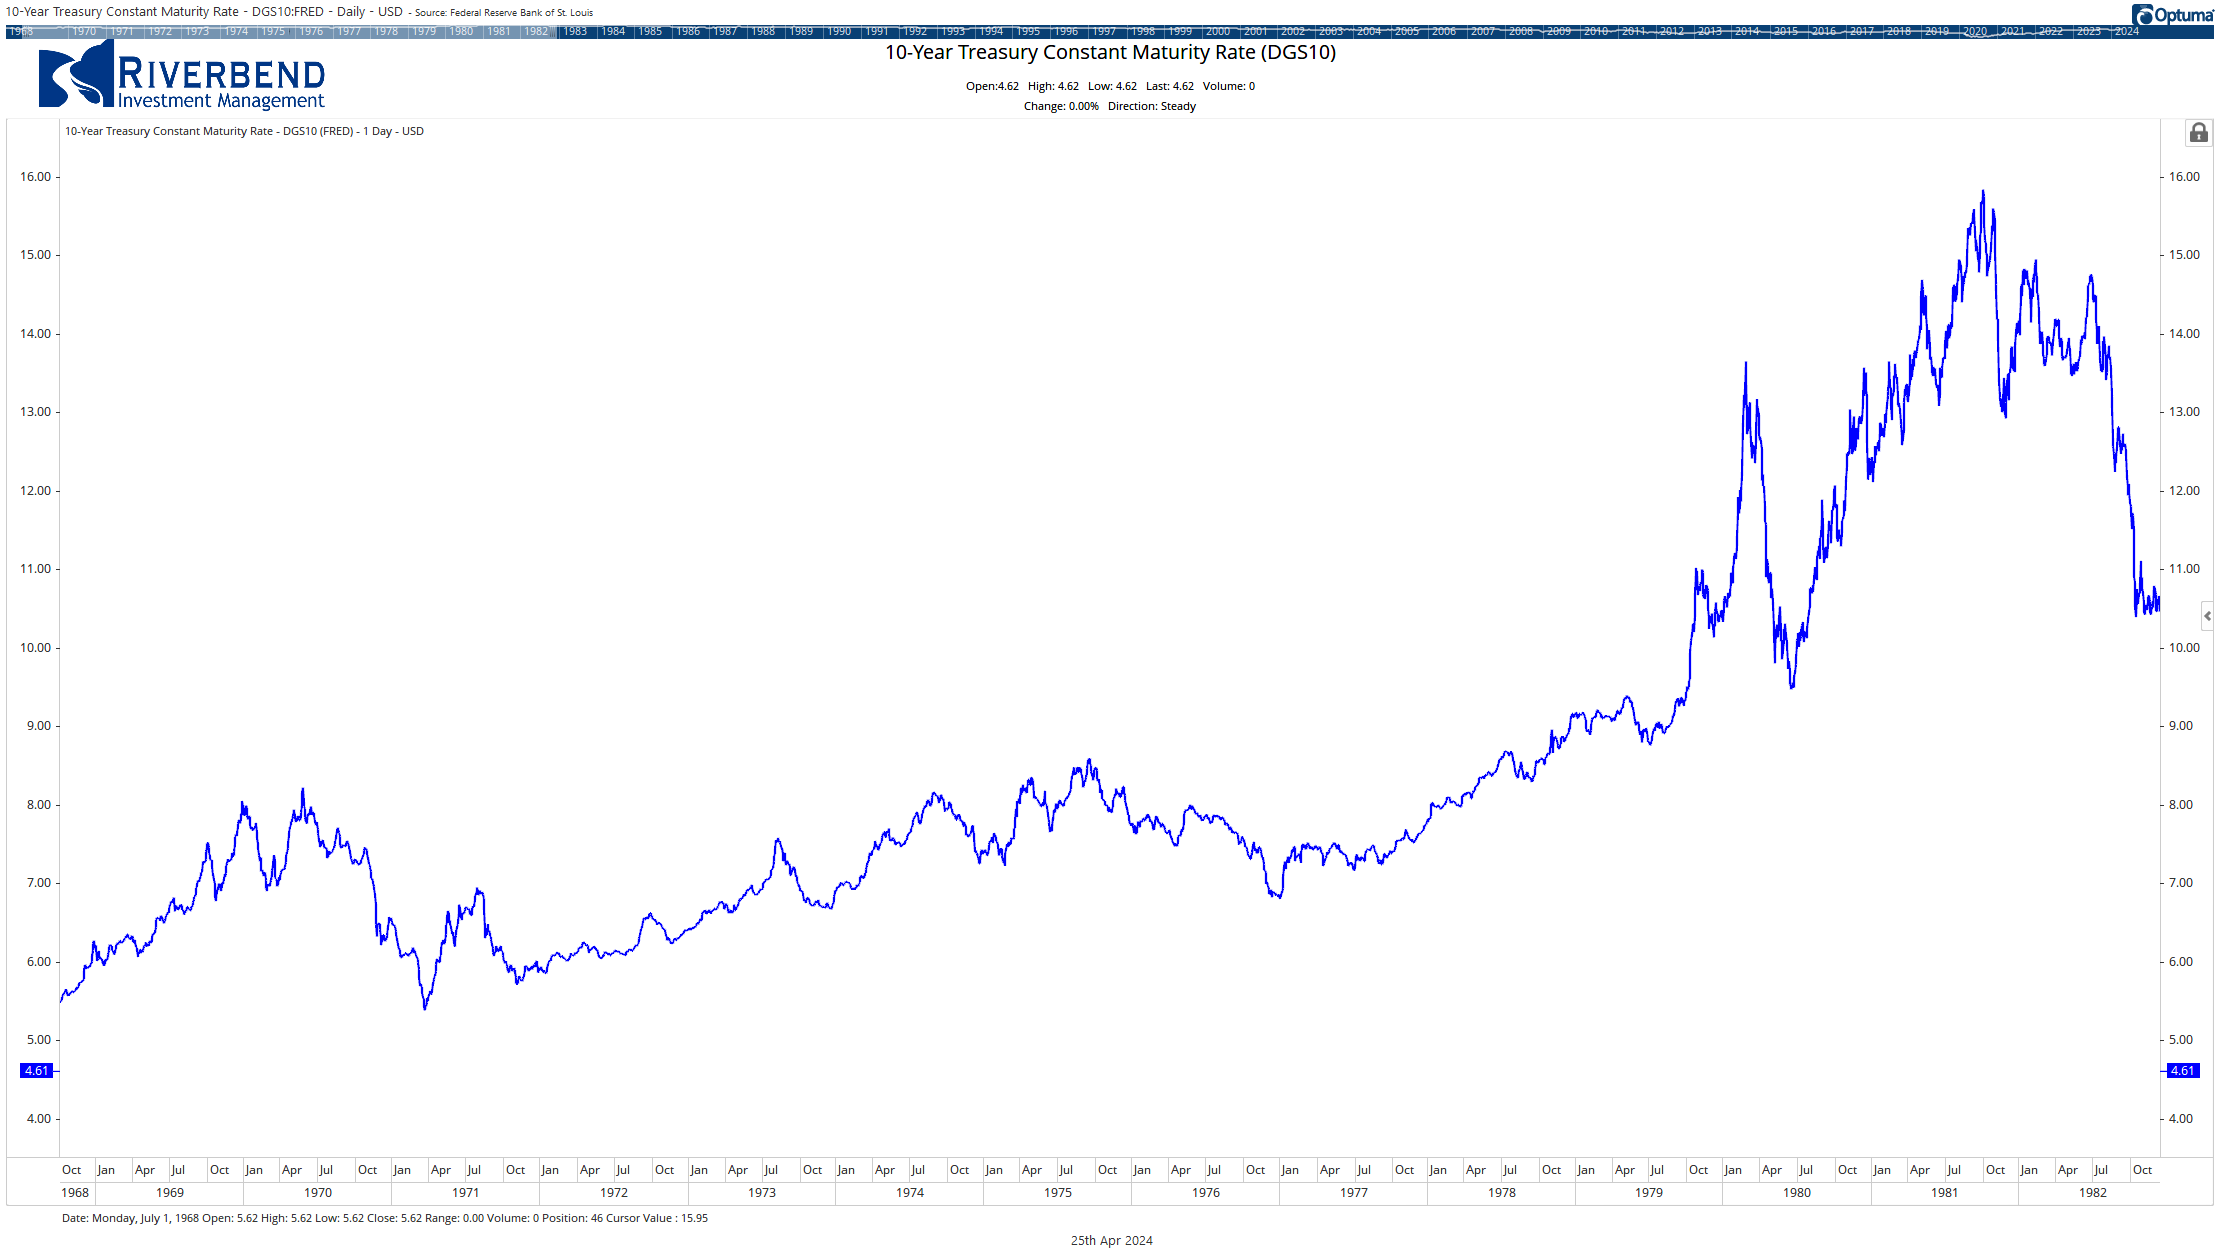
Fixed income investors suffered as rising interest rates caused bond prices to plummet. 10-year Treasury yields soared from around 6% in 1970 to over 15% by 1981 as the Federal Reserve belatedly raised rates to combat inflation. In 1979 alone, long-term government bonds lost 8.6%.
Growth Stocks
High-flying growth stocks sporting lofty price-to-earnings ratios were hit hard as soaring inflation and interest rates compressed valuations. The “Nifty Fifty” group of premier growth stocks like Xerox, IBM, and Polaroid that had led the bull market of the 1960s plunged during the 1973-74 bear market. Many former darlings saw their stock prices cut 60-90%.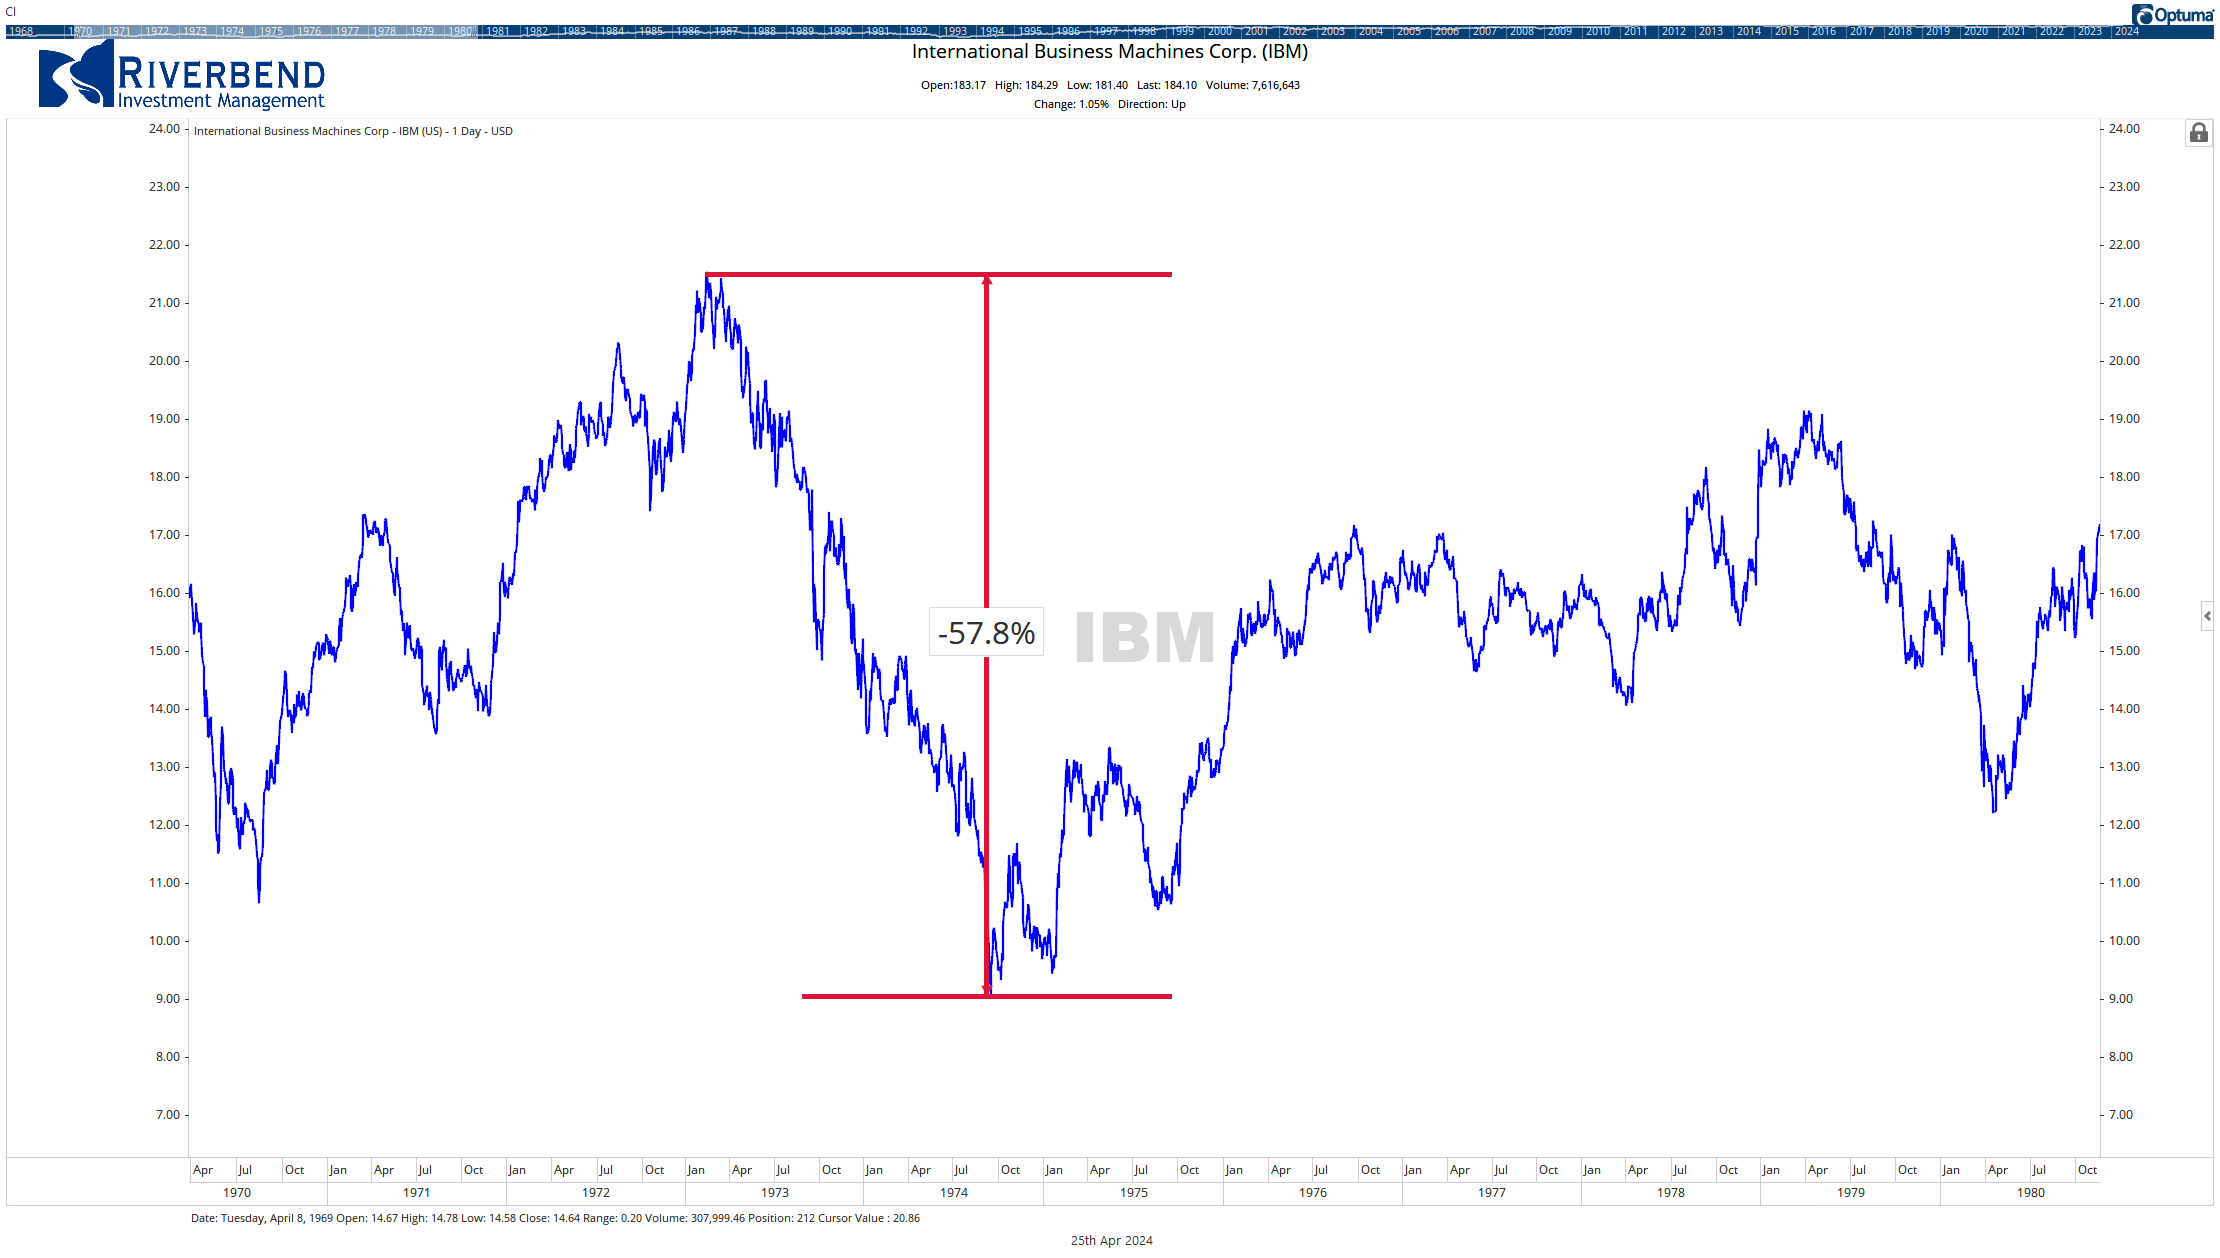
Sectors that struggled during this time included:
- Financials, as rising interest rates caused bond prices to plummet
- Consumer discretionary stocks, as economically-sensitive areas like autos and housing were hit by the combination of high inflation and slow growth
- Technology and growth stocks broadly underperformed as soaring inflation and interest rates compressed their rich valuations
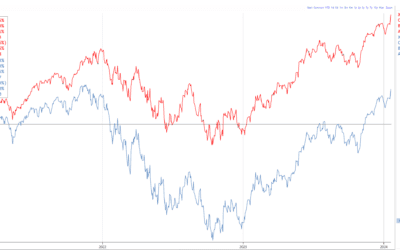
Autos, Housing and Consumer Discretionary
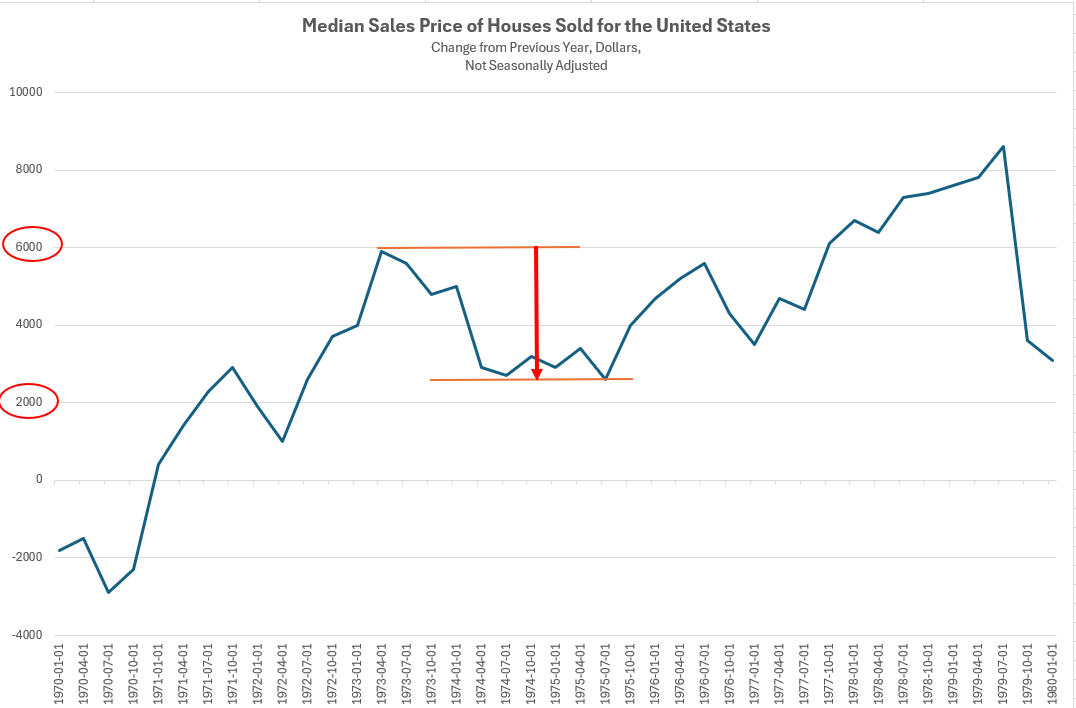 Source: Fred, Riverbend Investment Management
Economically-sensitive sectors were among the worst hit in the stagflationary environment. Auto sales slumped as rising gas prices and interest rates made vehicles unaffordable for many households. Housing starts fell nearly 50% from 1972-1982 as mortgage rates climbed to 18%. Consumer discretionary stocks broadly underperformed as stagflation curtailed household spending.
Lessons for Today’s Investors
While no two periods of history ever perfectly rhyme, the stagflationary 1970s offer some important takeaways for investors confronting high inflation and slowing growth today:
1. Diversify beyond stocks and bonds. Equities and fixed income both struggled during the 1970s. Exposure to real assets like commodities, real estate, and precious metals provided an important bulwark.
2. Emphasize value and quality. Richly-valued growth stocks are vulnerable to valuation compression as inflation and interest rates rise. Cheaper value stocks and high-quality blue chips tend to fare better.
3. Tilt toward inflation beneficiaries. Sectors with direct exposure to rising commodity prices (energy, mining, agriculture) or that demonstrate strong pricing power (consumer staples, healthcare) have outperformed during stagflationary periods.
4. Tactical investment strategies may provide opportunities during flat, yet volatile market cycles.
While the future is always uncertain, the historical experience of the 1970s provides a useful roadmap for navigating the potentially stagflationary environment ahead.
Sources:
[1] https://www.schroders.com/en-us/us/individual/insights/how-does-stagflation-impact-investment-returns/
[2] https://www.fool.com/terms/s/stagflation/
[3] https://www.investopedia.com/terms/s/stagflation.asp
[4] https://www.winvesta.in/blog/what-happens-to-the-markets-during-stagflation
[5] https://www.forbes.com/advisor/investing/stagflation/
[6] https://www.investopedia.com/articles/economics/08/1970-stagflation.asp
[7] https://www.investopedia.com/articles/economics/08/stagflation.asp
[8] https://www.reddit.com/r/investing/comments/tdvcb2/stagflation_in_the_1970s_stagflation_in_the_in/
[9] https://willowdaleequity.com/blog/what-assets-do-well-in-stagflation/
[10] https://finance.yahoo.com/news/stagflation-definition-10-best-stagflation-183011442.html
[11] https://finance.yahoo.com/news/stagflation-definition-11-best-stagflation-174922577.html
[12] https://www.gsam.com/content/gsam/us/en/institutions/market-insights/gsam-connect/2022/what-investors-can-do-stagflation-risk.html
[13] https://www.kiplinger.com/investing/economy/want-to-beat-stagflation-invest-like-its-the-1970s
[14] https://www.schroders.com/en-ch/ch/professional/insights/inflation-back-to-the-1970s/
[15] https://www.schiffsovereign.com/trends/what-worked-and-didnt-work-during-1970s-stagflation-27738/
[16] https://www.marketwatch.com/story/stock-market-investors-should-still-brace-for-70s-style-stagflation-warn-strategists-39dc3675
[17] https://www.kiplinger.com/investing/stocks/604318/5-superb-stocks-to-shield-against-stagflation
[18] https://www.dbresearch.com/PROD/RPS_EN-PROD/PROD0000000000523476/Investing_during_Stagflation:_What_happened_in_the.pdf