Value vs Growth: Is A Decade of Value Leadership Coming?
After the tumultuous stock market swings of this year, many investors are starting to re-evaluate their portfolios and are wondering Value vs Growth, which will outperform going forward?
Since the Great Financial Crisis of 2008-2009, growth stocks have significantly outperformed their value counterparts.
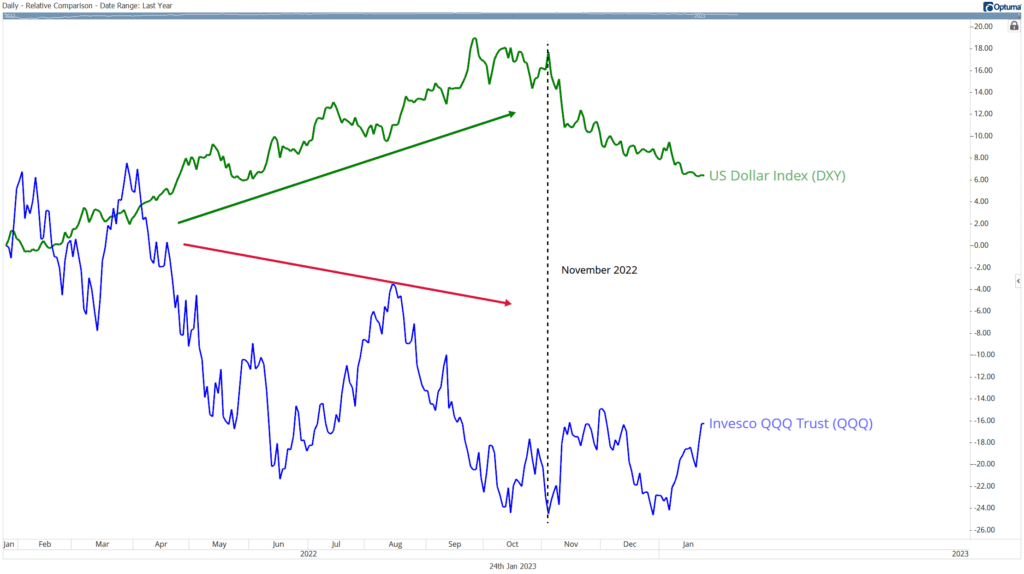
However, the tides may be turning after rising interest rates and a strong US dollar have had a significantly negative impact on some of the leading names within the technology sector.
FANNG Stocks
As interest rates rose during 2022, the so-called darlings of the technology sector, often referred to as FANNG stocks, saw large price declines since their January 2022 peak.
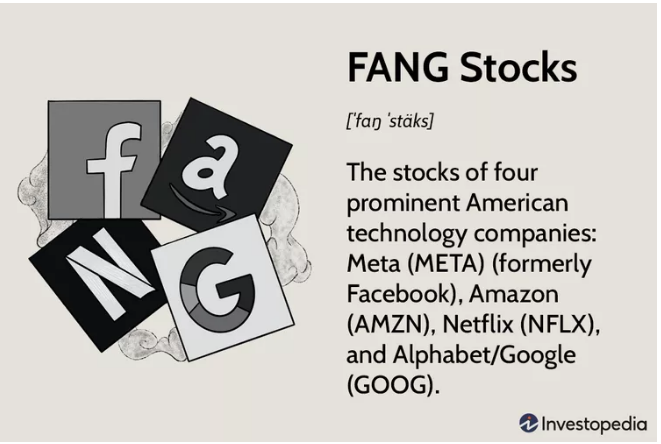
Investopedia / Ryan Oakley
The NYSE FANG + Index is an index that tracks the performance of 10 highly-traded growth stocks of technology and tech-enabled companies in the technology, media & communications, and consumer discretionary sectors.
The index includes FANNG stocks (Meta/Facebook, Amazon, Netflix, and Alphabet/Google), and is unique in that it also includes some of the other Wall Street darlings. such as Tesla (TSLA) and NVIDA (NVDA).
From its peak in January 2022 to its low in November 2022, the NYSE FANG+ Index declined nearly 50%.
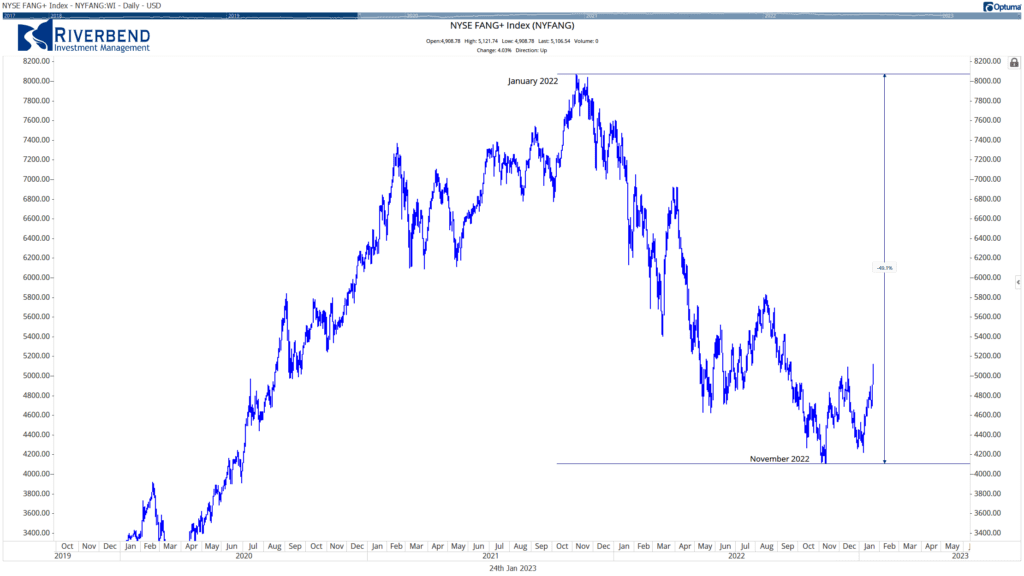
Some FANNG stocks saw even larger declines than the index itself.
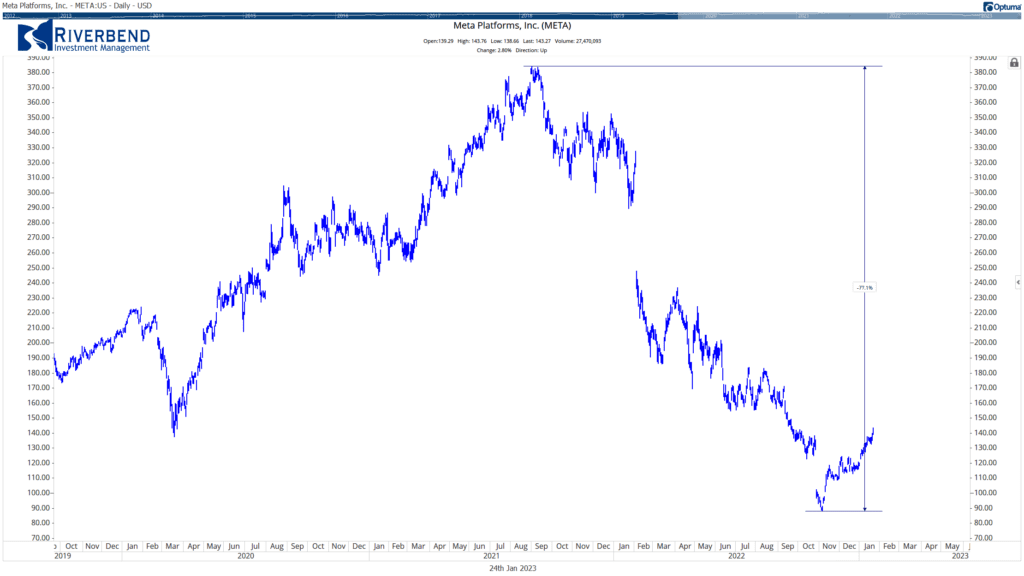
META (formerly Facebook)
Meta saw approximately a 77% decline in price:
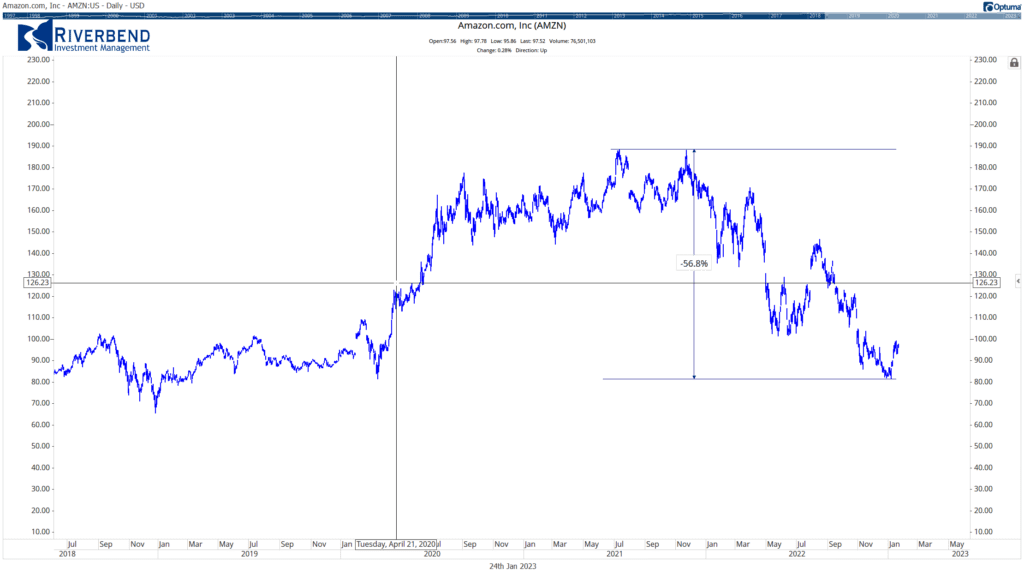
Amazon (AMZN)
Amazon saw approximately a 57% decline in price:
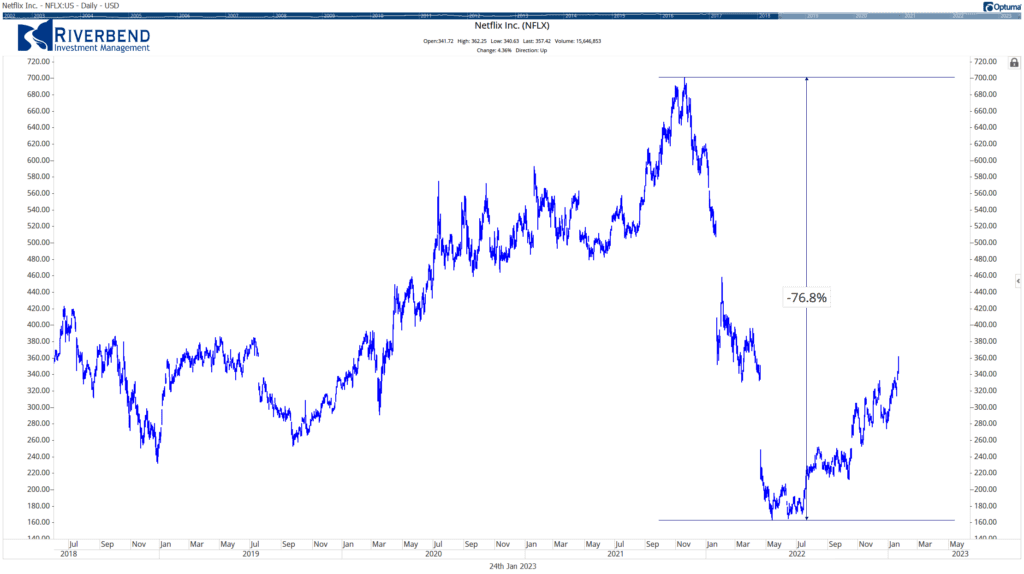
Netflix (NFLX)
Netflix saw approximately a 76% decline in price:
Growth Leadership Pre-2022
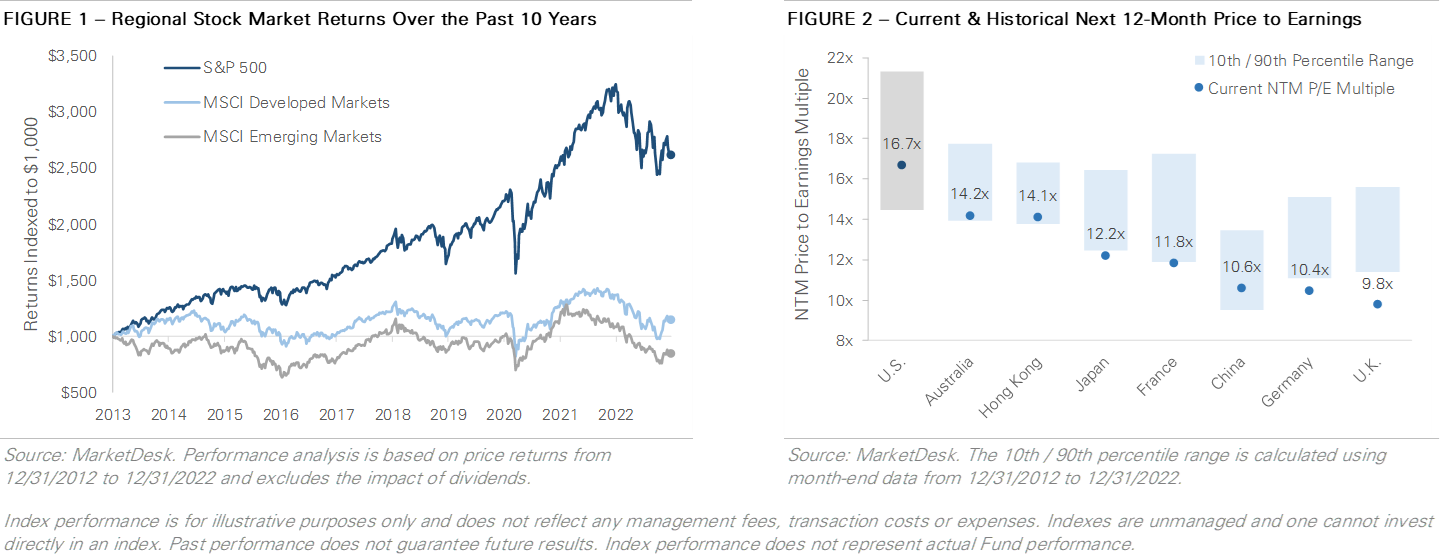
From March 2009 to January 2022, the S&P 500 Growth Index (using the ETF “SPYG” as a proxy), had a total return of approximately 913%.
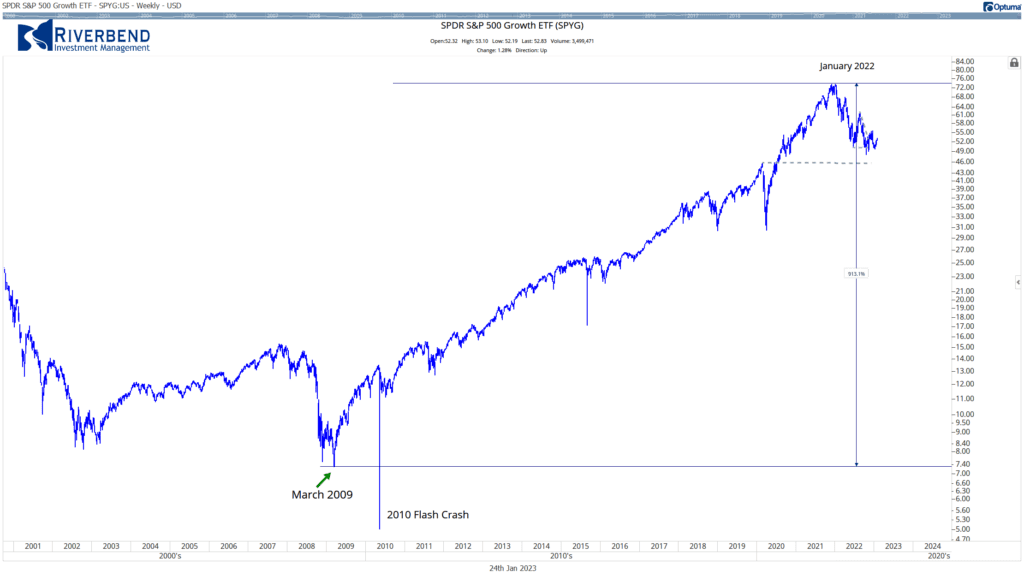
Meanwhile, during the same period, Value (using the ETF “SPYV” as a proxy) returned approximately 388%.
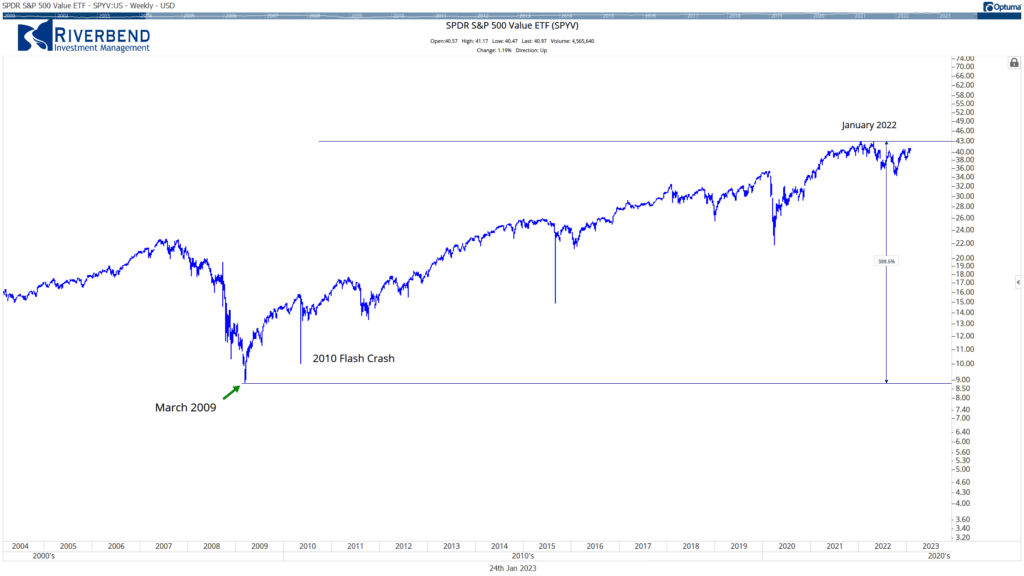
During this time we saw the Technology sector balloon up to 25% of the S&P 500 index. 38% if we include the Communications Sector. No wonder investors were quick to exit the tech sector.
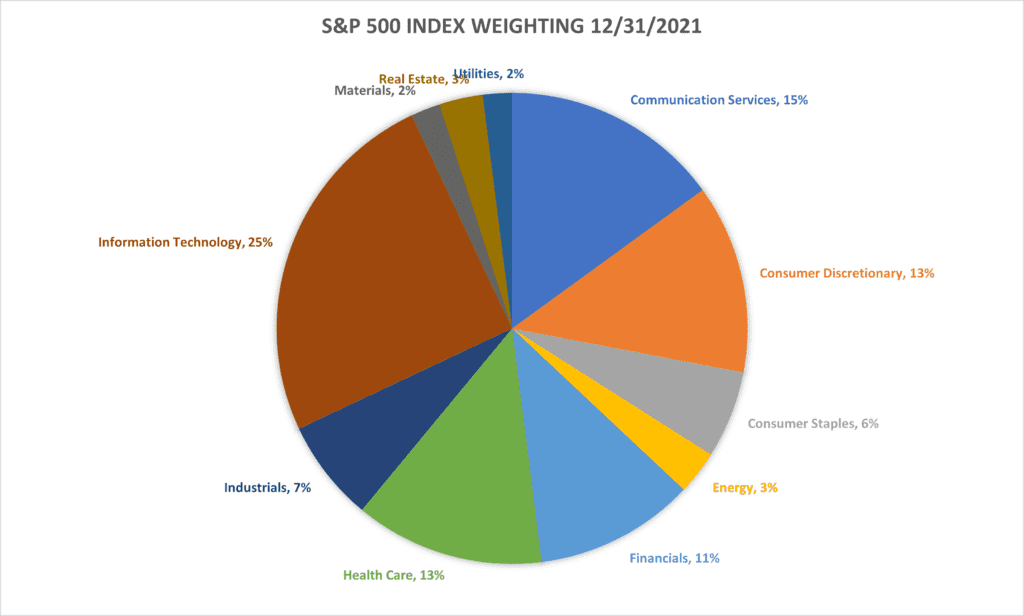
Data source: State Street
Value vs Growth Leadership?
However, this outperformance of growth stocks may be ending — and potentially starting a decade of outperformance from their value counterparts.
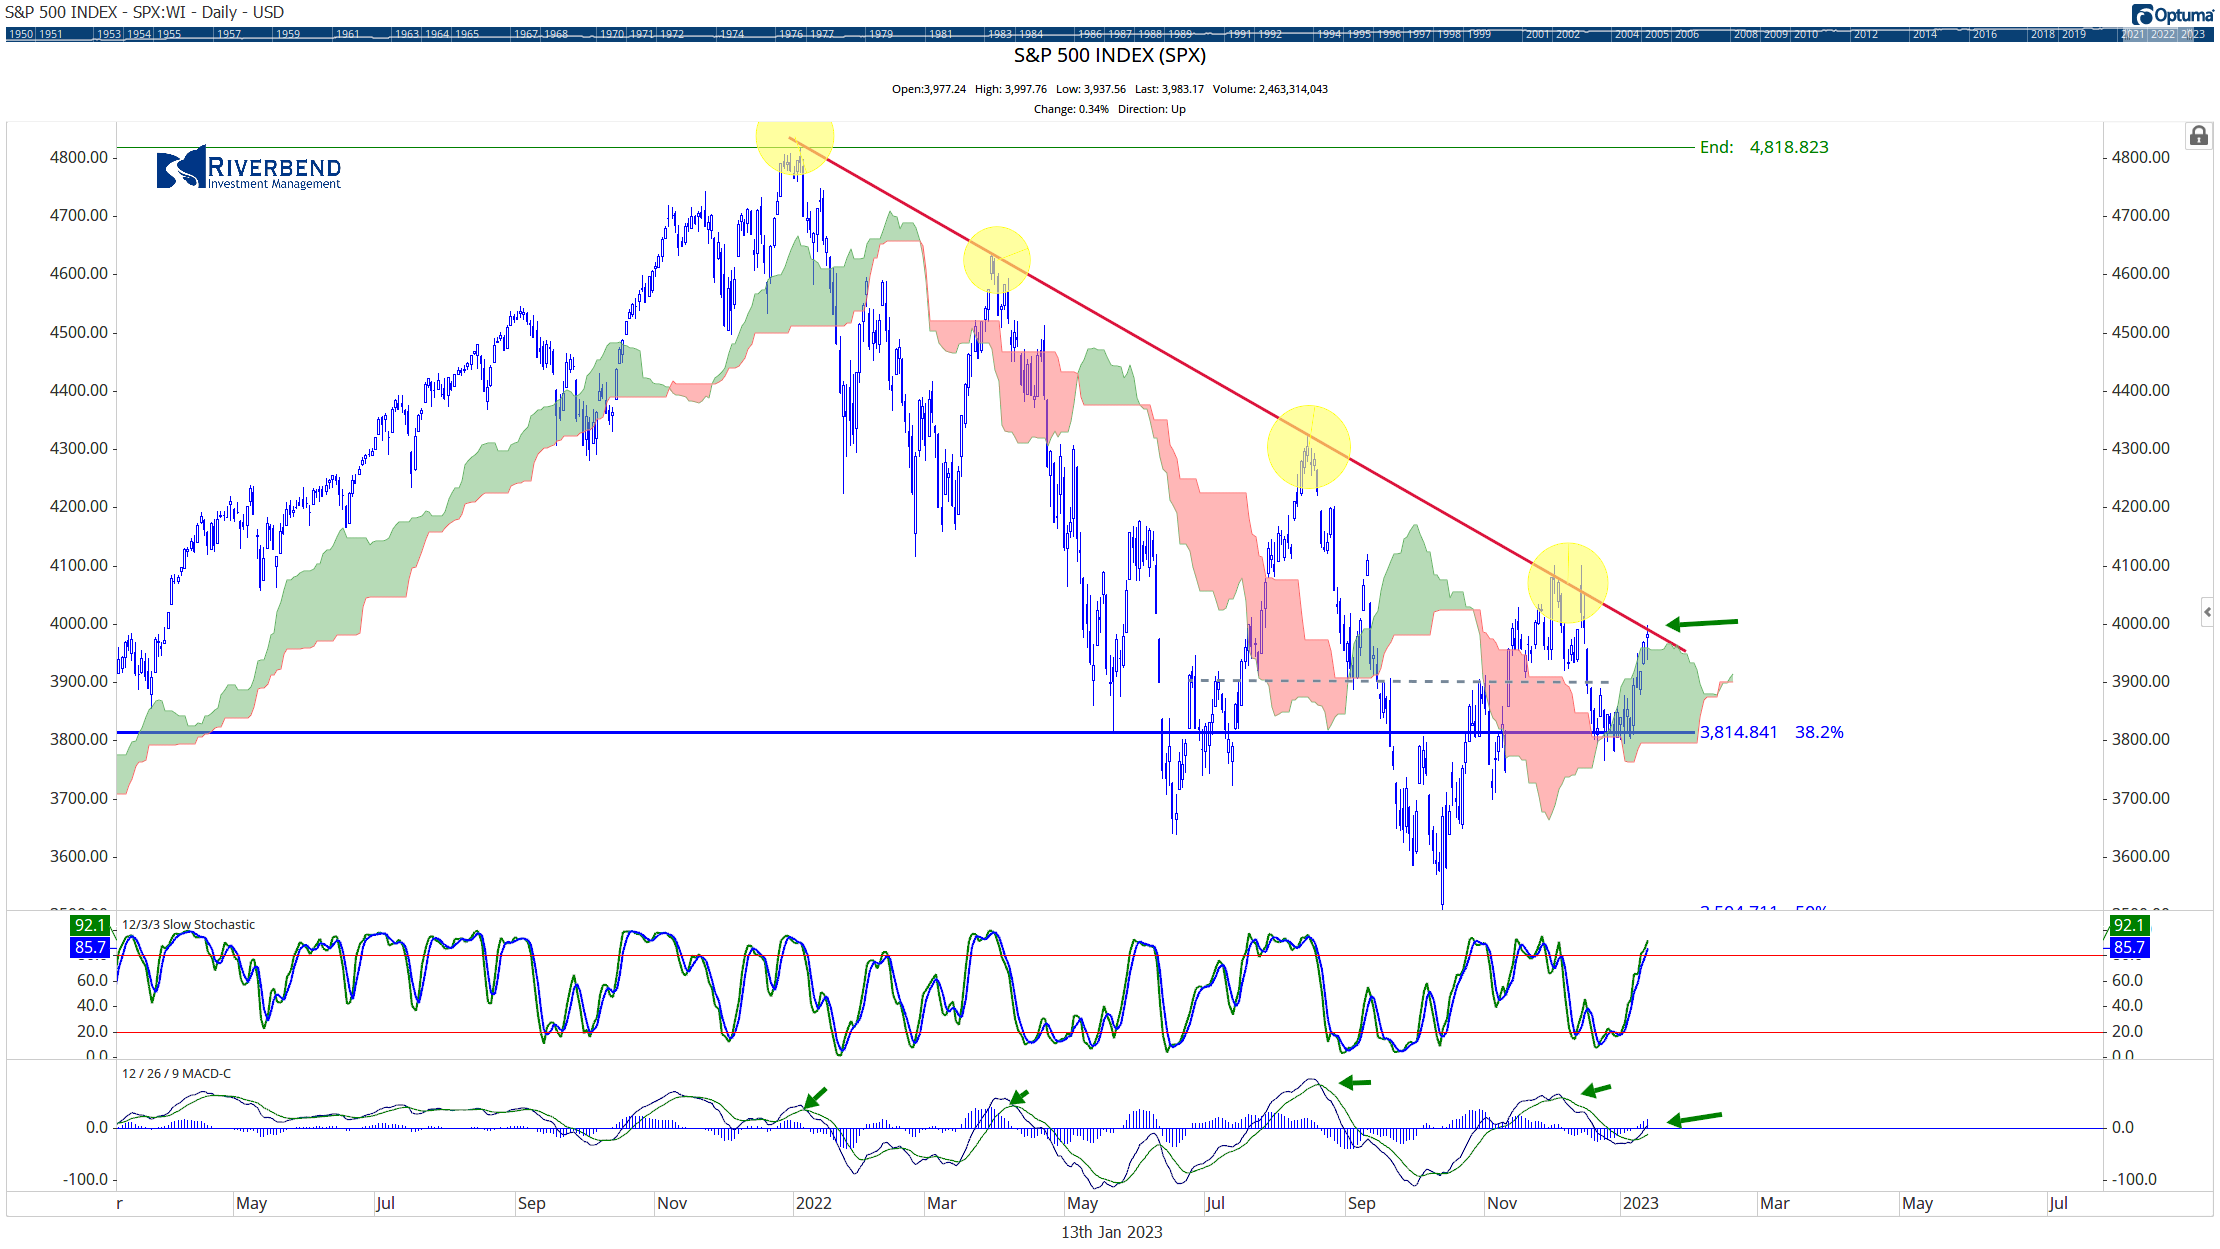
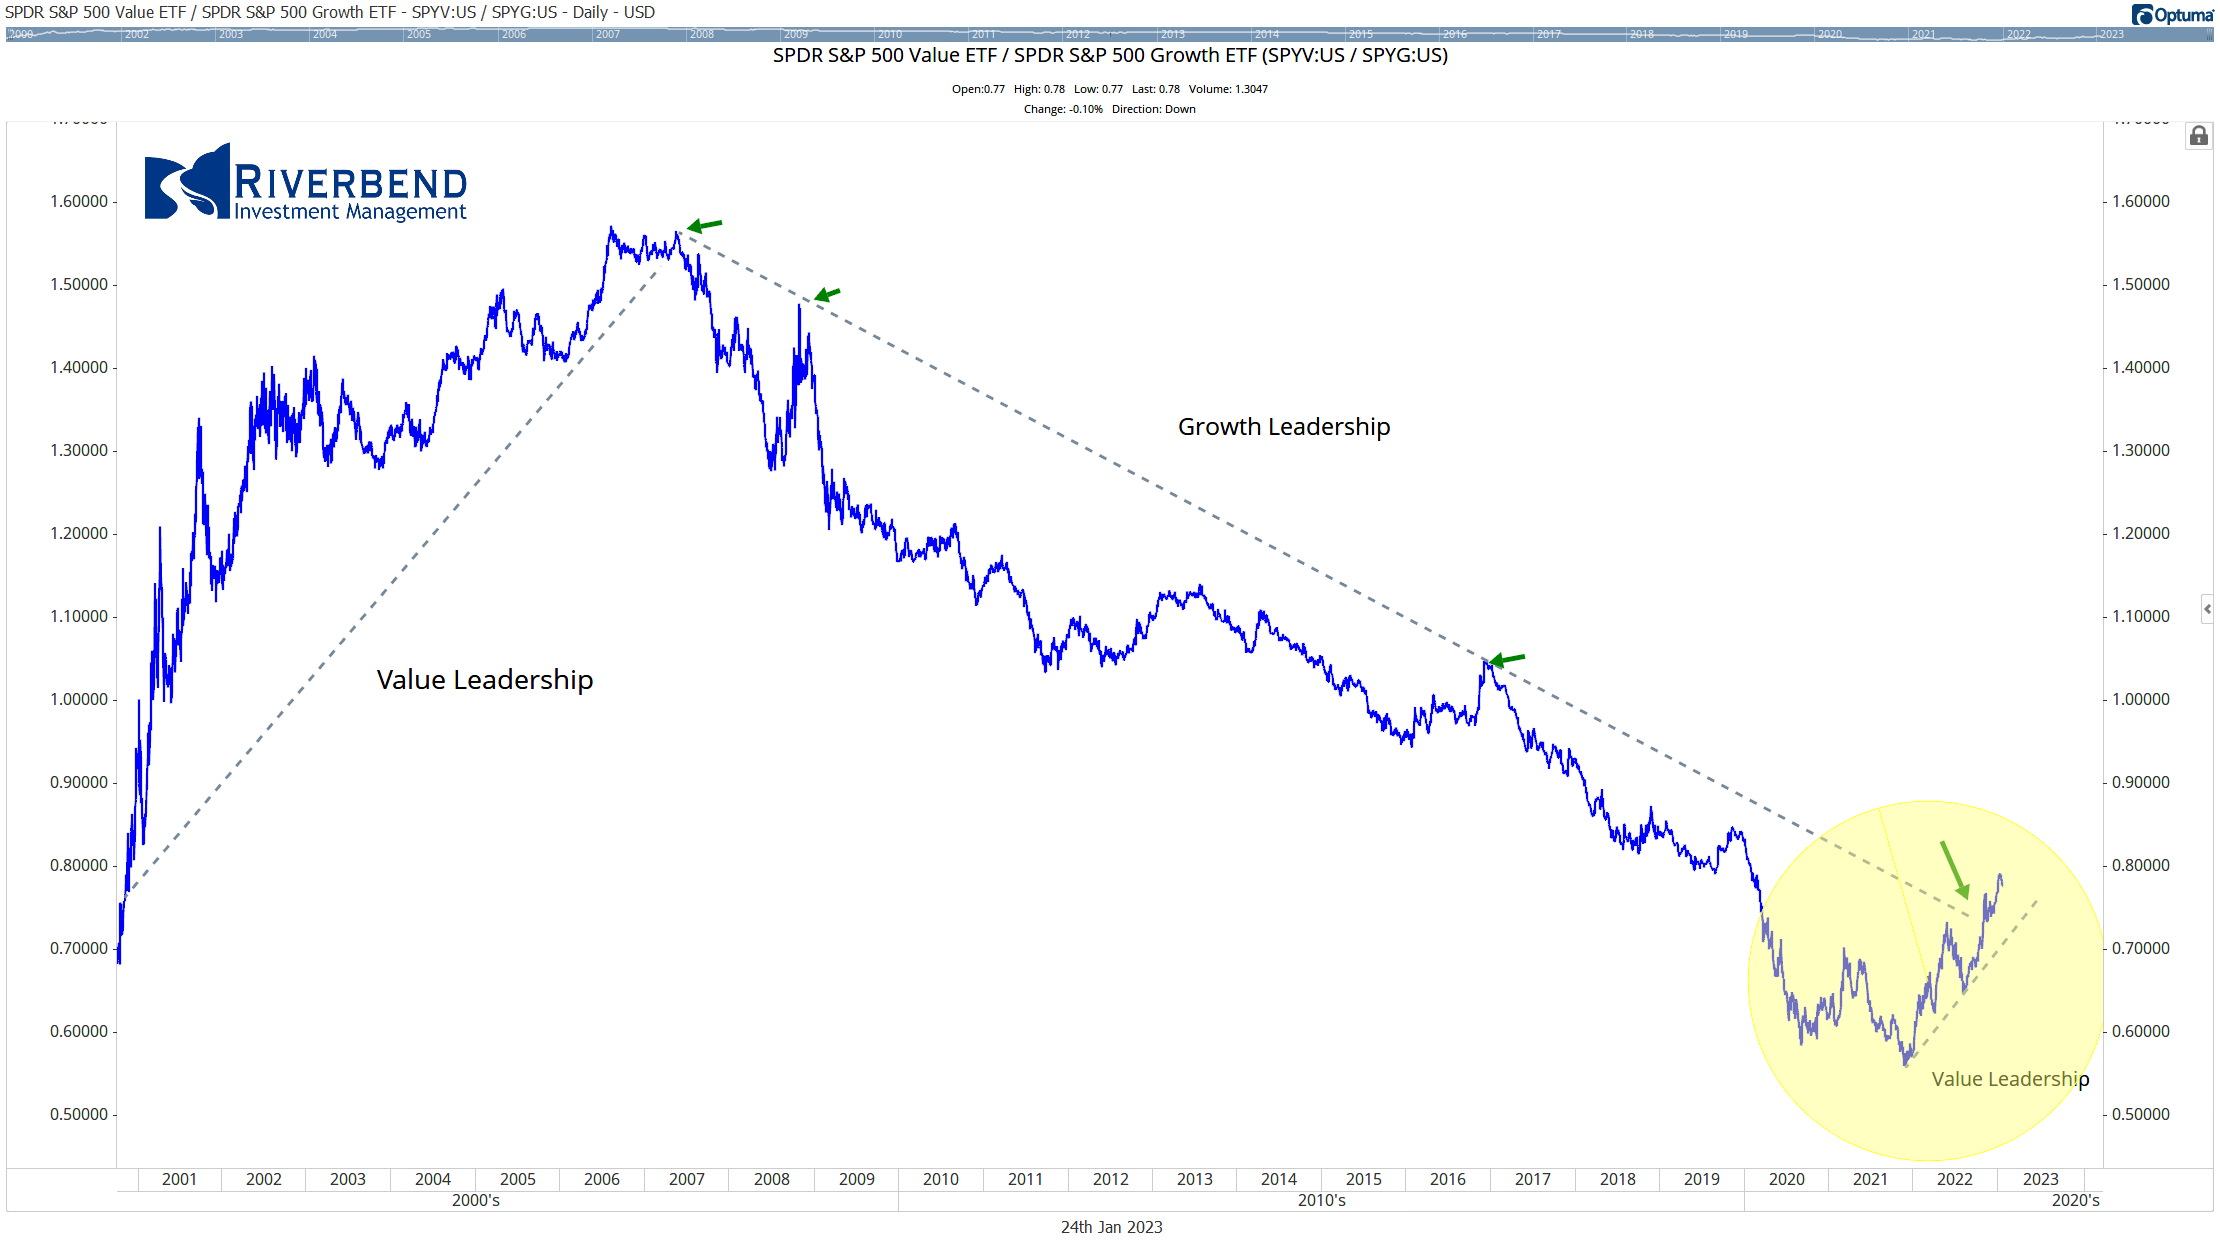
Since the November lows, the relationship between Growth and Value names has traded place.
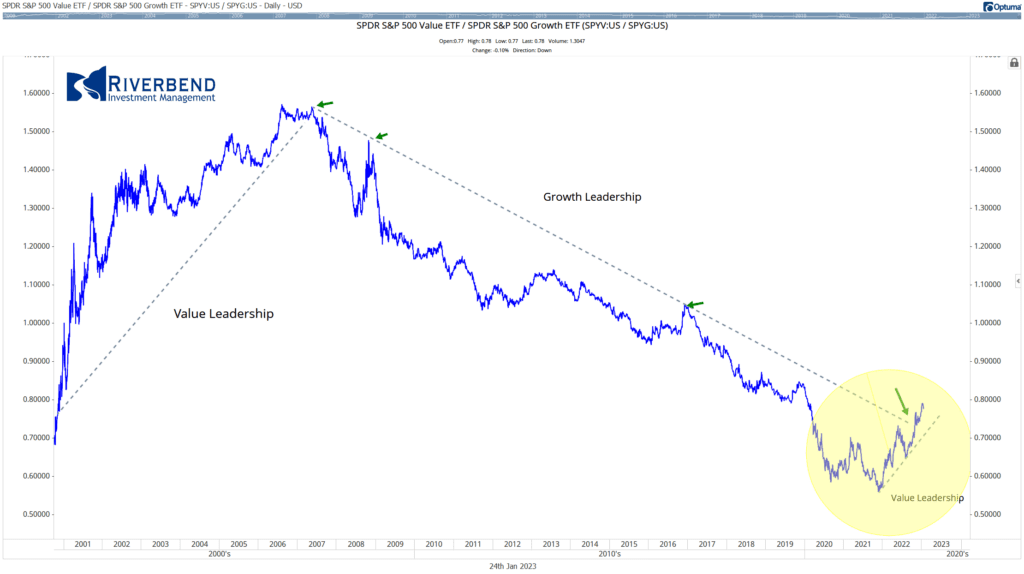
If we take a look at the relative strength comparison between S&P 500 Value and S&P 500 Growth, we can see that after the Tech Collapse in 2000-2001, Value stocks outperformed Growth stocks on a relative basis up until the Great Financial Crisis.
After 2009, Value underperformed Growth — until the stock market lows in November 2022.
Will Value Stocks Continue to Outperform Growth?
Simply looking at the trend comparison between Growth and Value, it can be easy to say “yes”.
But, let’s take a deeper look.
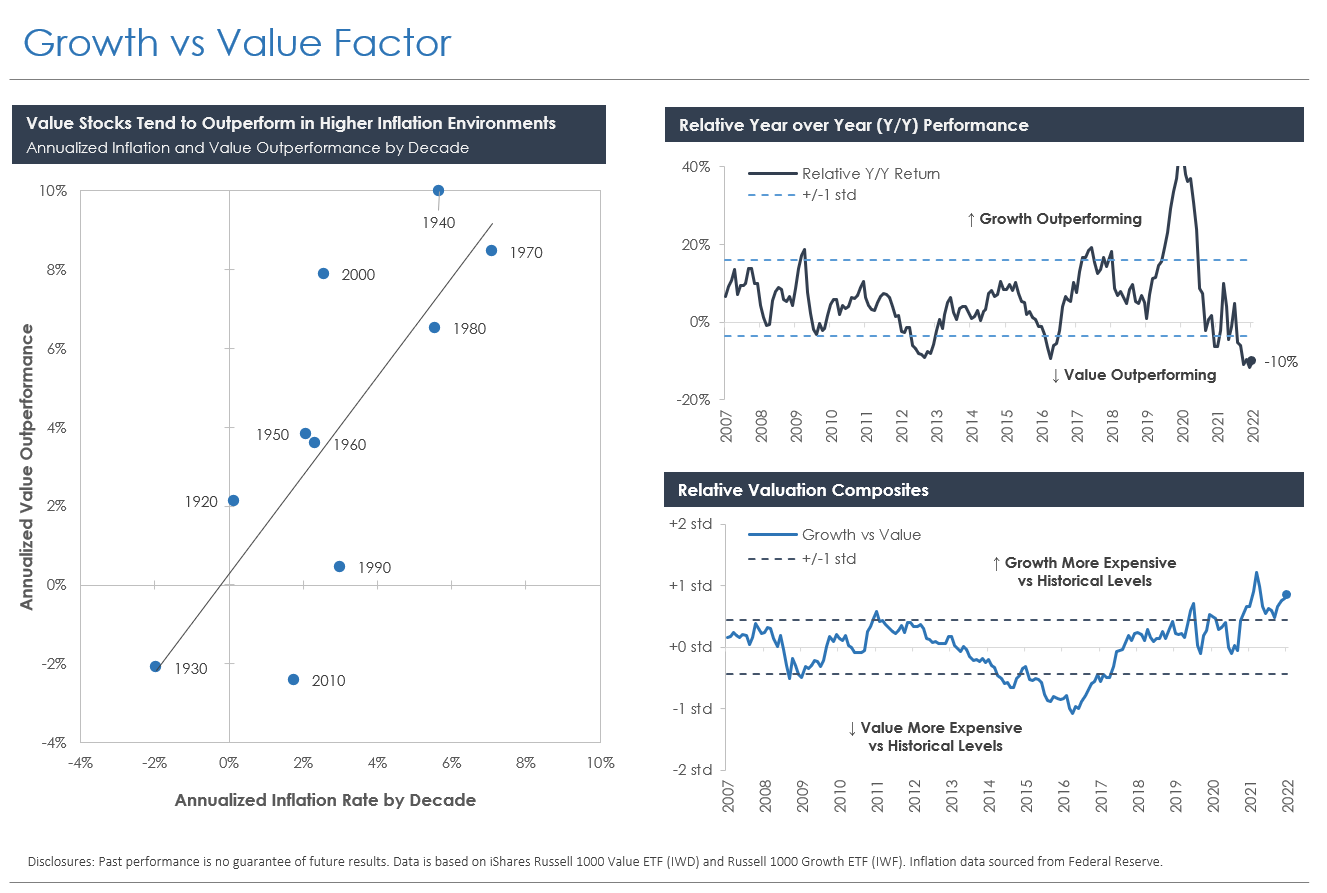
Value companies, which tend to generate profits in the short term, may be less affected by fluctuations in interest rates and inflation than growth companies, which focus on long-term profits.
Changes in interest rates have also created opportunities for active investors to find undervalued stocks with strong fundamentals, which may see an increase in value as investors recognize their potential.
“During higher inflation environments, investors tend to rotate away from growth into value as present income and strong cash flows become more important,” Sherifa Issifu, associate, index investment strategy at S&P Dow Jones Indices.”
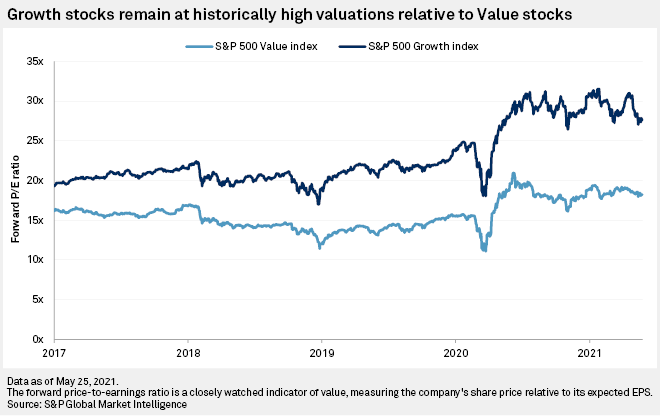
Source: S&P 500 Global Market Intelligence
To further the impact of rising interest rates on growth stocks, a lot of investors and research analysts rely on the Net Present Value (NPV) model.
The NPV model discounts projected cash flows to the present using a discount rate, which is typically the 10-year Treasury yield.
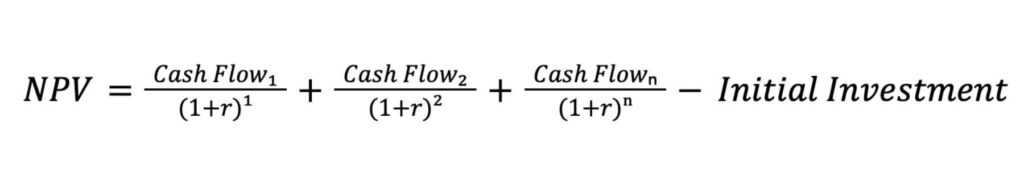
So, as interest rates rise, the companies with greater cash flows may look more attractive to investors.
For now, investors should keep an eye on the relative relationship between Growth and Value stocks to help them get a better understanding of where the broader market’s inflows and outflows are.