by John Rothe | Economic Research
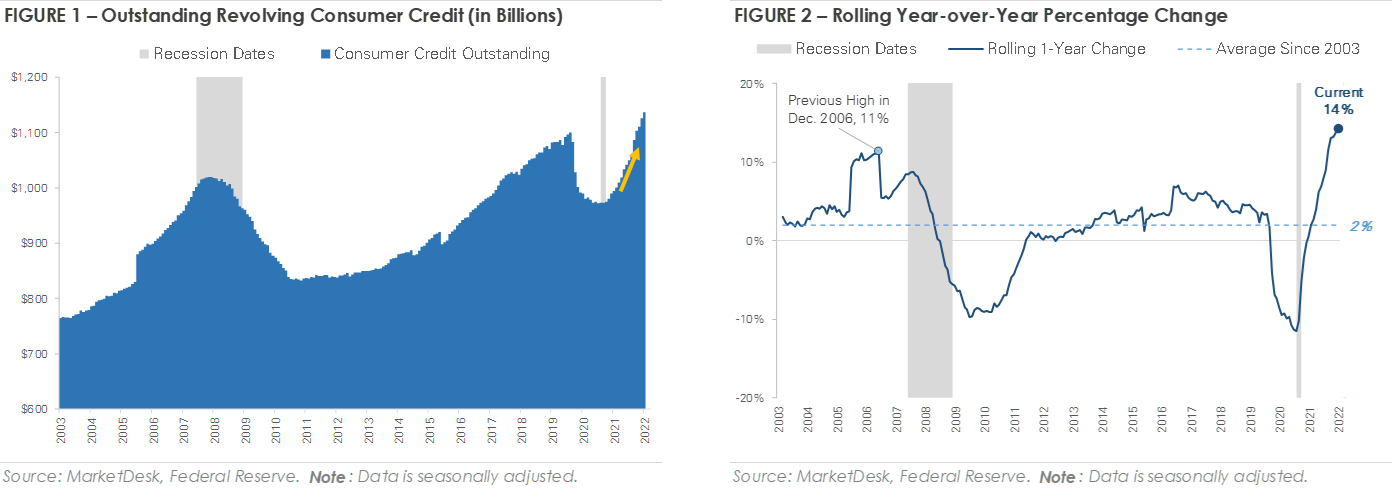
This month’s charts examine the trend of increasing consumer credit usage. Figure 1 charts the amount of outstanding revolving consumer credit, and Figure 2 charts the year-over-year percentage growth of revolving credit. Revolving credit, such as a credit card, allows the account holder to borrow money repeatedly up to a set credit limit while making monthly payments. The charts show credit usage initially decreased during the pandemic as consumers used government stimulus checks and savings from fewer discretionary purchases to pay down debt.
After declining during the pandemic, data shows consumer credit usage is rising again and now back above pre-pandemic levels. The increase in credit usage started during 2021 as the effect of stimulus checks faded and the economic reopening released a wave of pent-up demand. Credit usage continues to increase during 2022 as inflation increases the price of everyday necessities, such as gas, groceries, and housing.
The increase in consumer credit usage raises an important point. Credit cards are an easy and common way to borrow money, but they are also one of the most expensive forms of borrowing. Most credit cards charge a variable interest rate tied to the prime rate, which is linked to the federal funds rate.
This year’s interest rate increases by the Federal Reserve are intended to ease inflation pressures, but they also make carrying a credit card balance more expensive. An increase in the federal funds rate increases the prime rate, which in turn increases the interest rate charged on credit cards. According to a recent survey by Bankrate.com, the average credit card interest rate reached 17.96% at the end of August, which marks the highest level since 1996.
The increase in mortgage and auto loan rates is getting all the attention this year, but the increase in credit card interest rates is more impactful to everyday life. Credit cards are a valuable tool to manage your personal finances, such as building up a credit score, increasing your purchasing power, and earning rewards. However, credit cards can also create negative issues, such as overspending, high balances, and high interest expenses, when misused and mismanaged.
by John Rothe | Investment Research
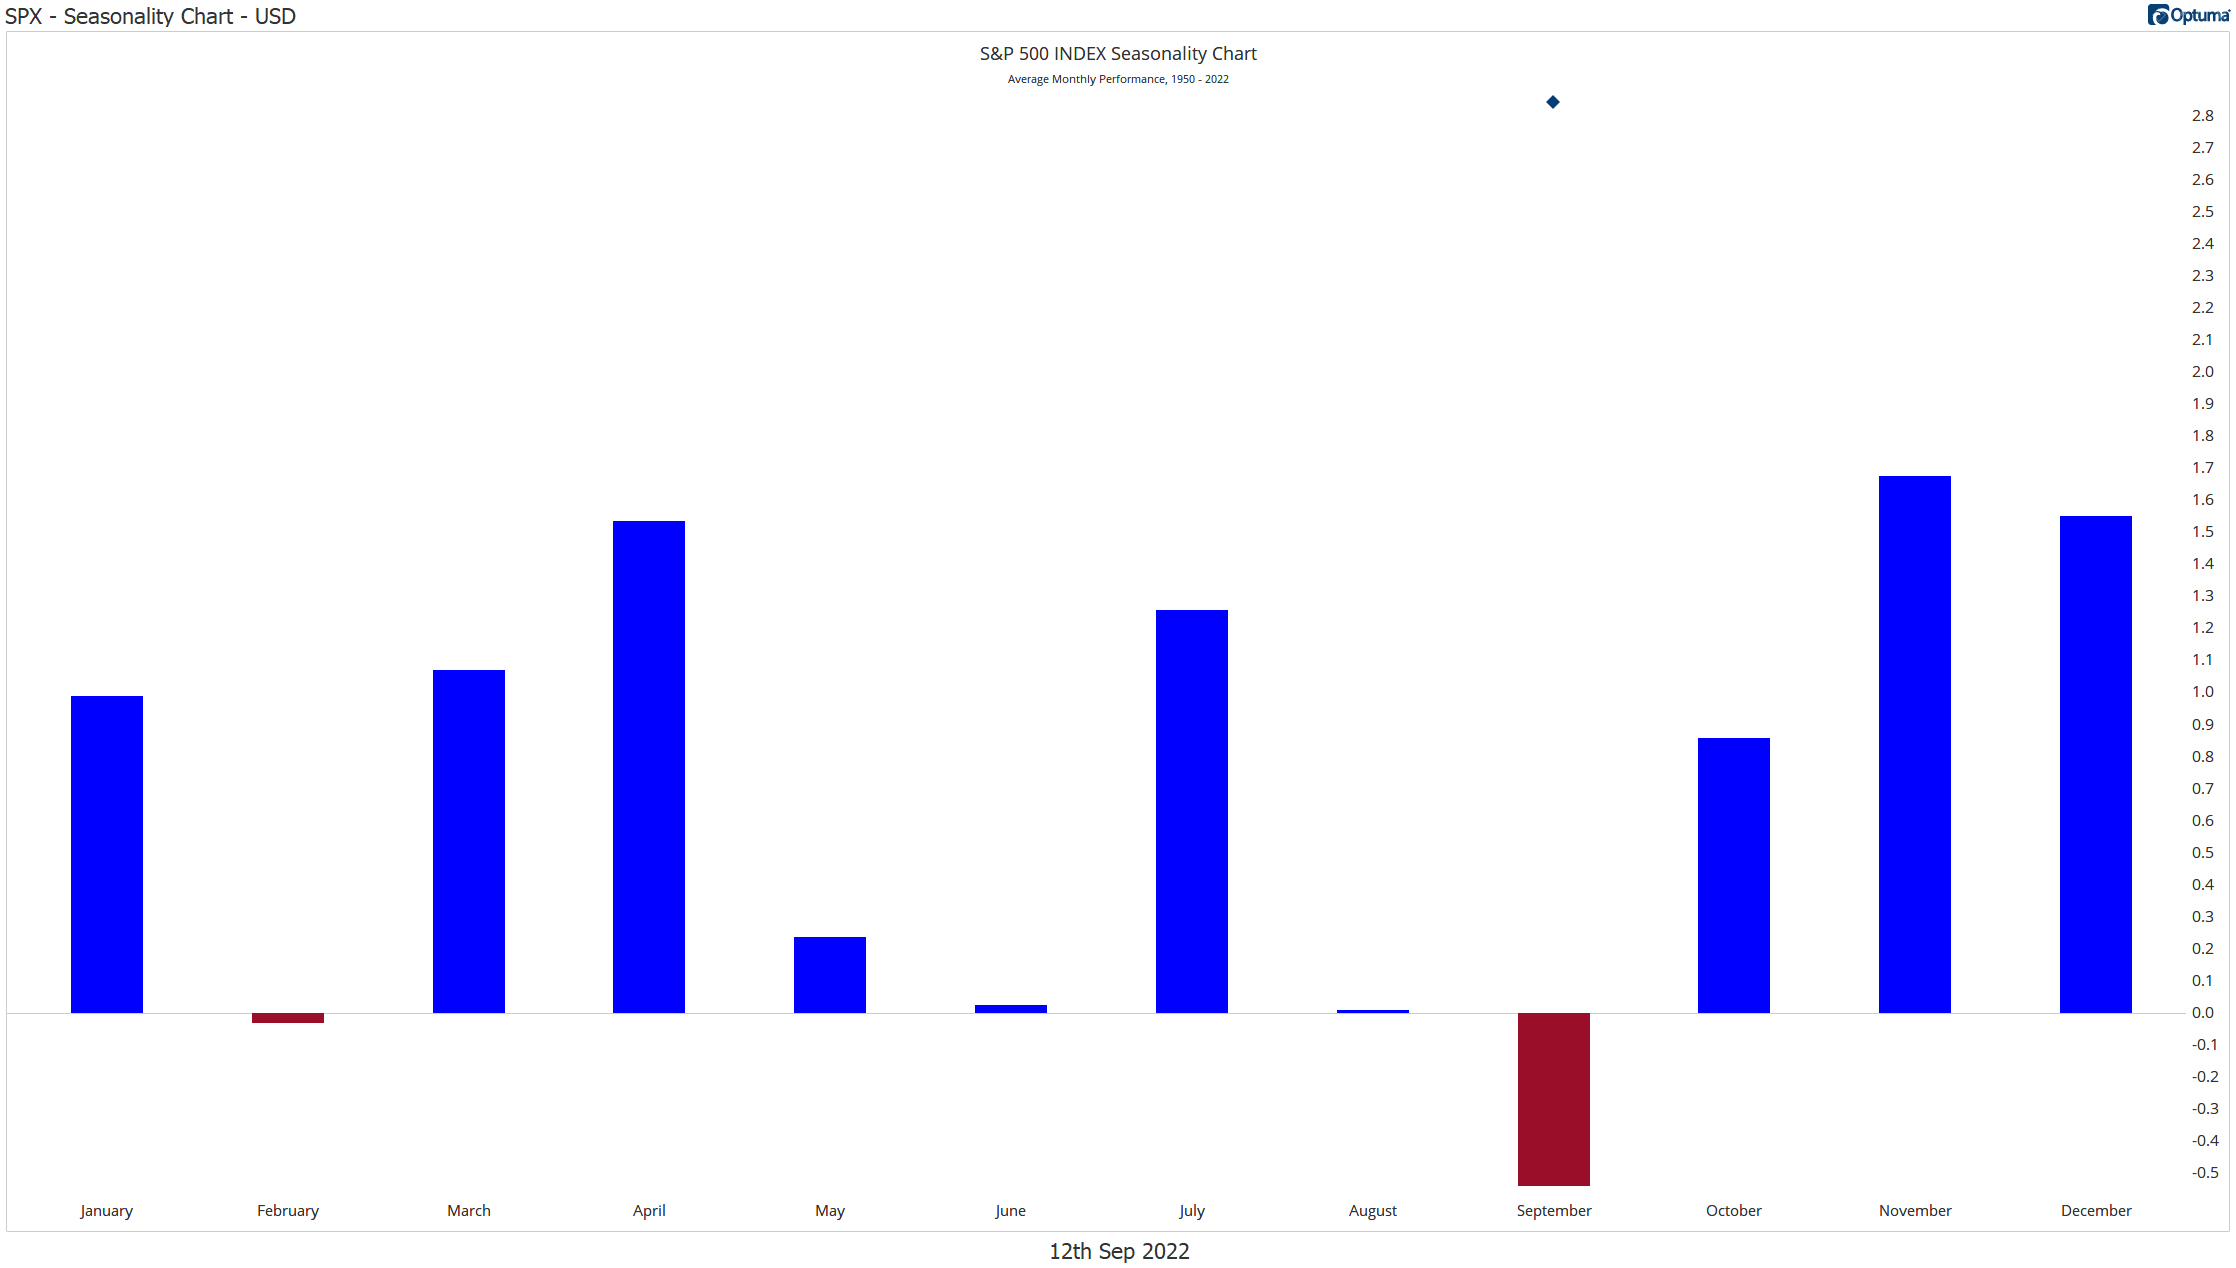
Historical lookback of returns during the month of September. 1950 to 2022(as of 9/12/2022)
by John Rothe | Investment Research
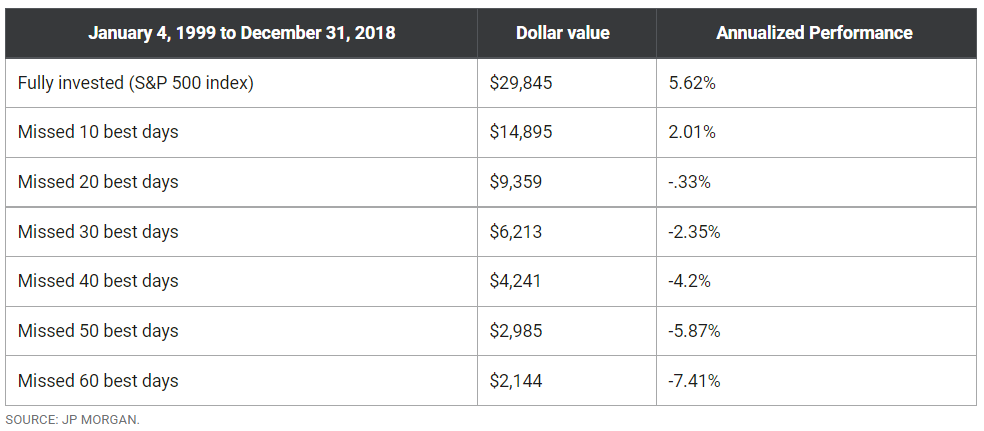
One of the more “sticky” myths in the stock market is that of staying fully invested so you don’t miss the best days.
Charts like this are common among fans of buy and hold strategies:
However, what charts like this fail to mention is that the best days often follow the worst days.
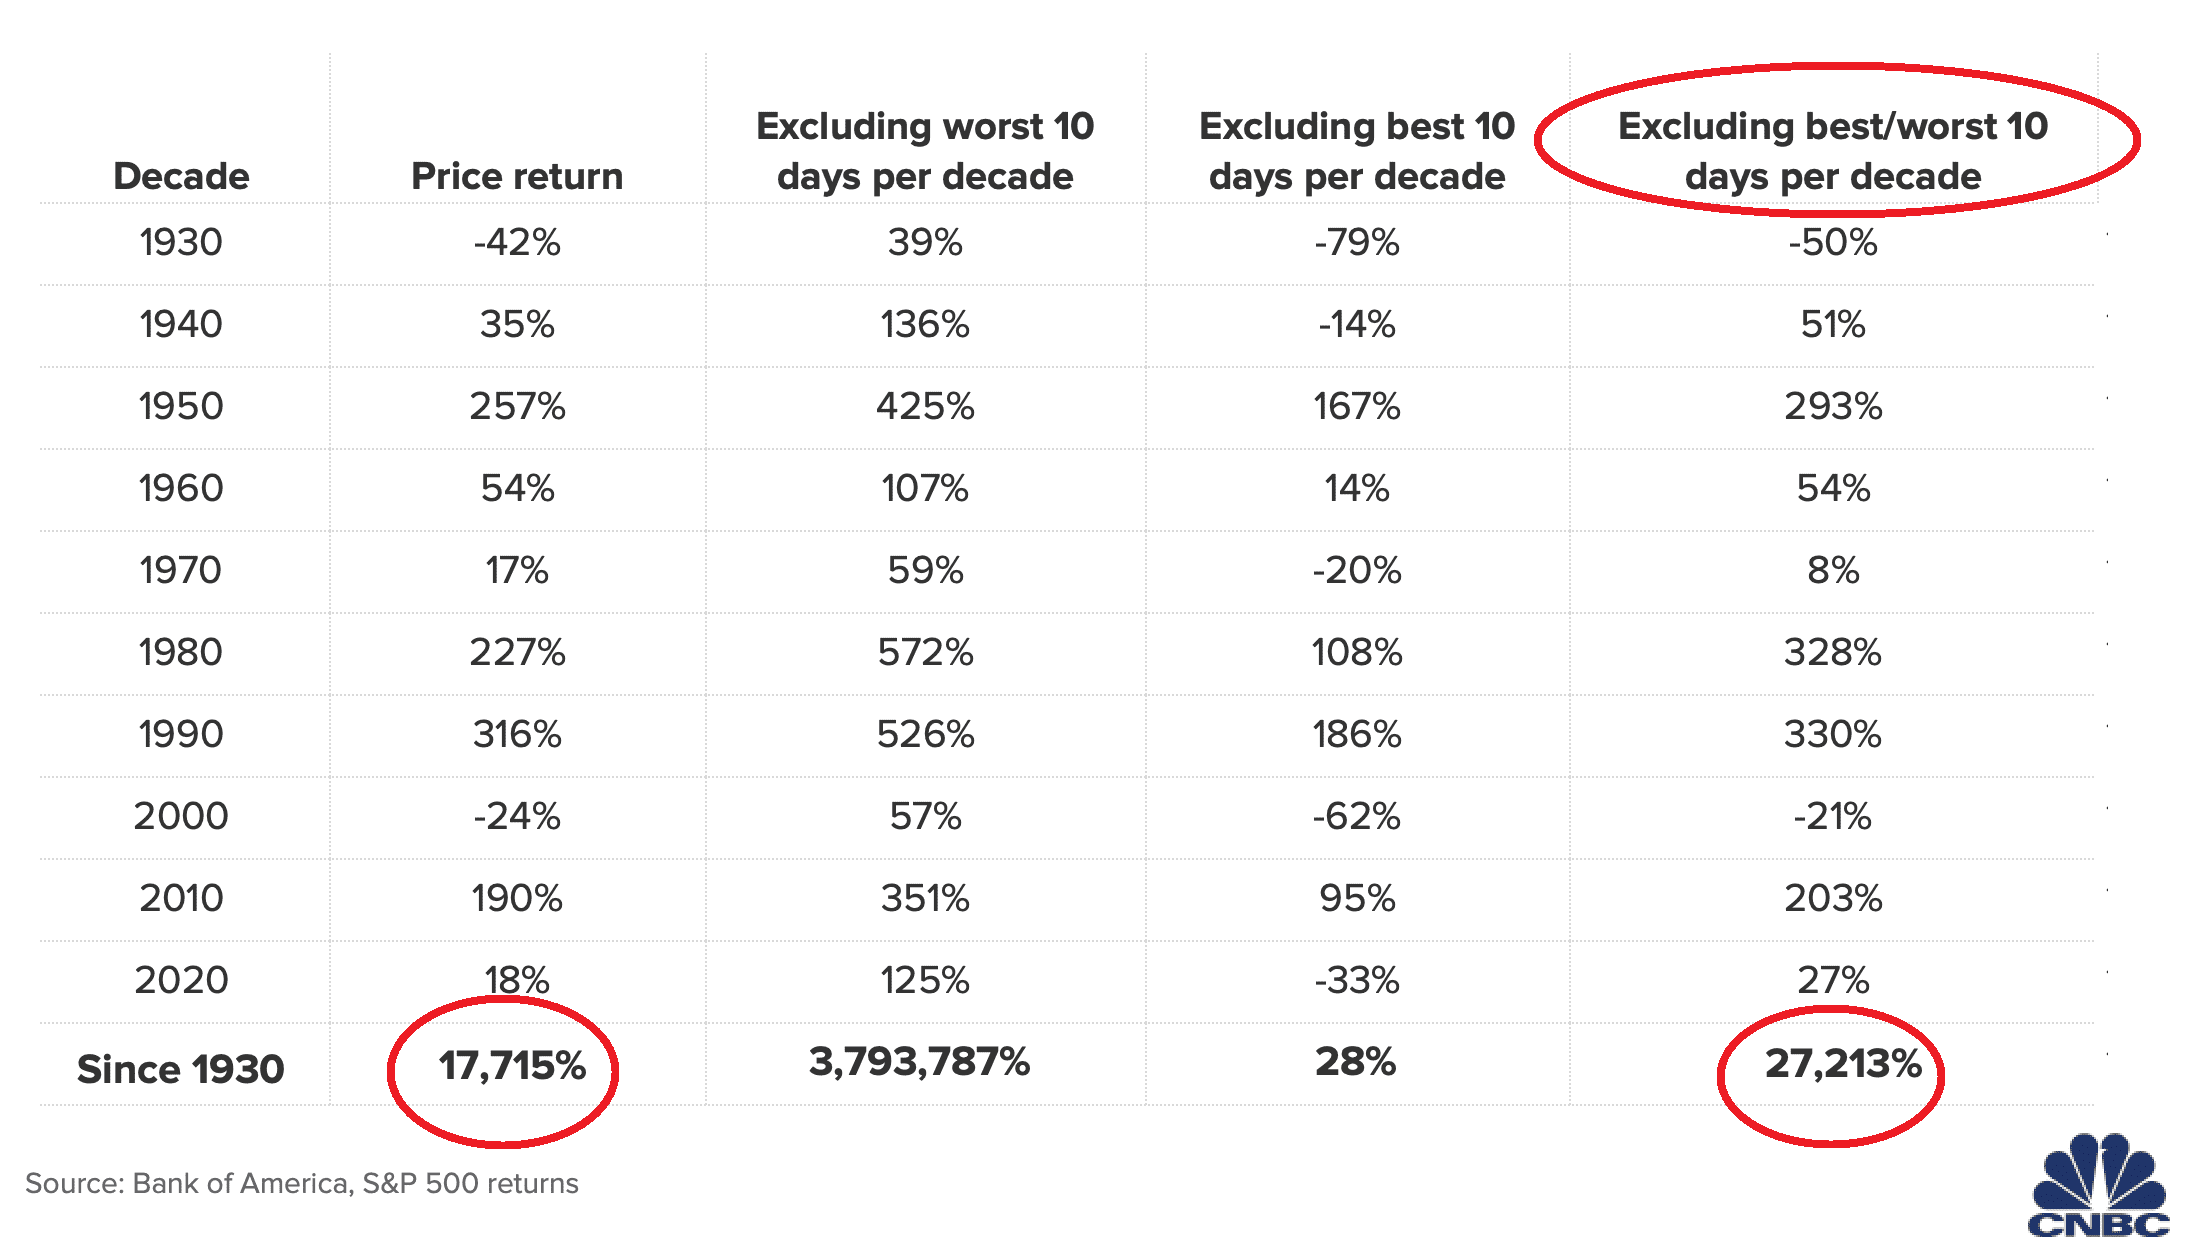
There are some powerful arguments that missing BOTH the best and worst days can be beneficial:
How can an investor miss both the best and the worst days?
Applying a 200-day moving average as a signal to exit the market has worked surprisingly well.
The majority of the best and worst days occur when the stock market is trading below its 200-day moving average.
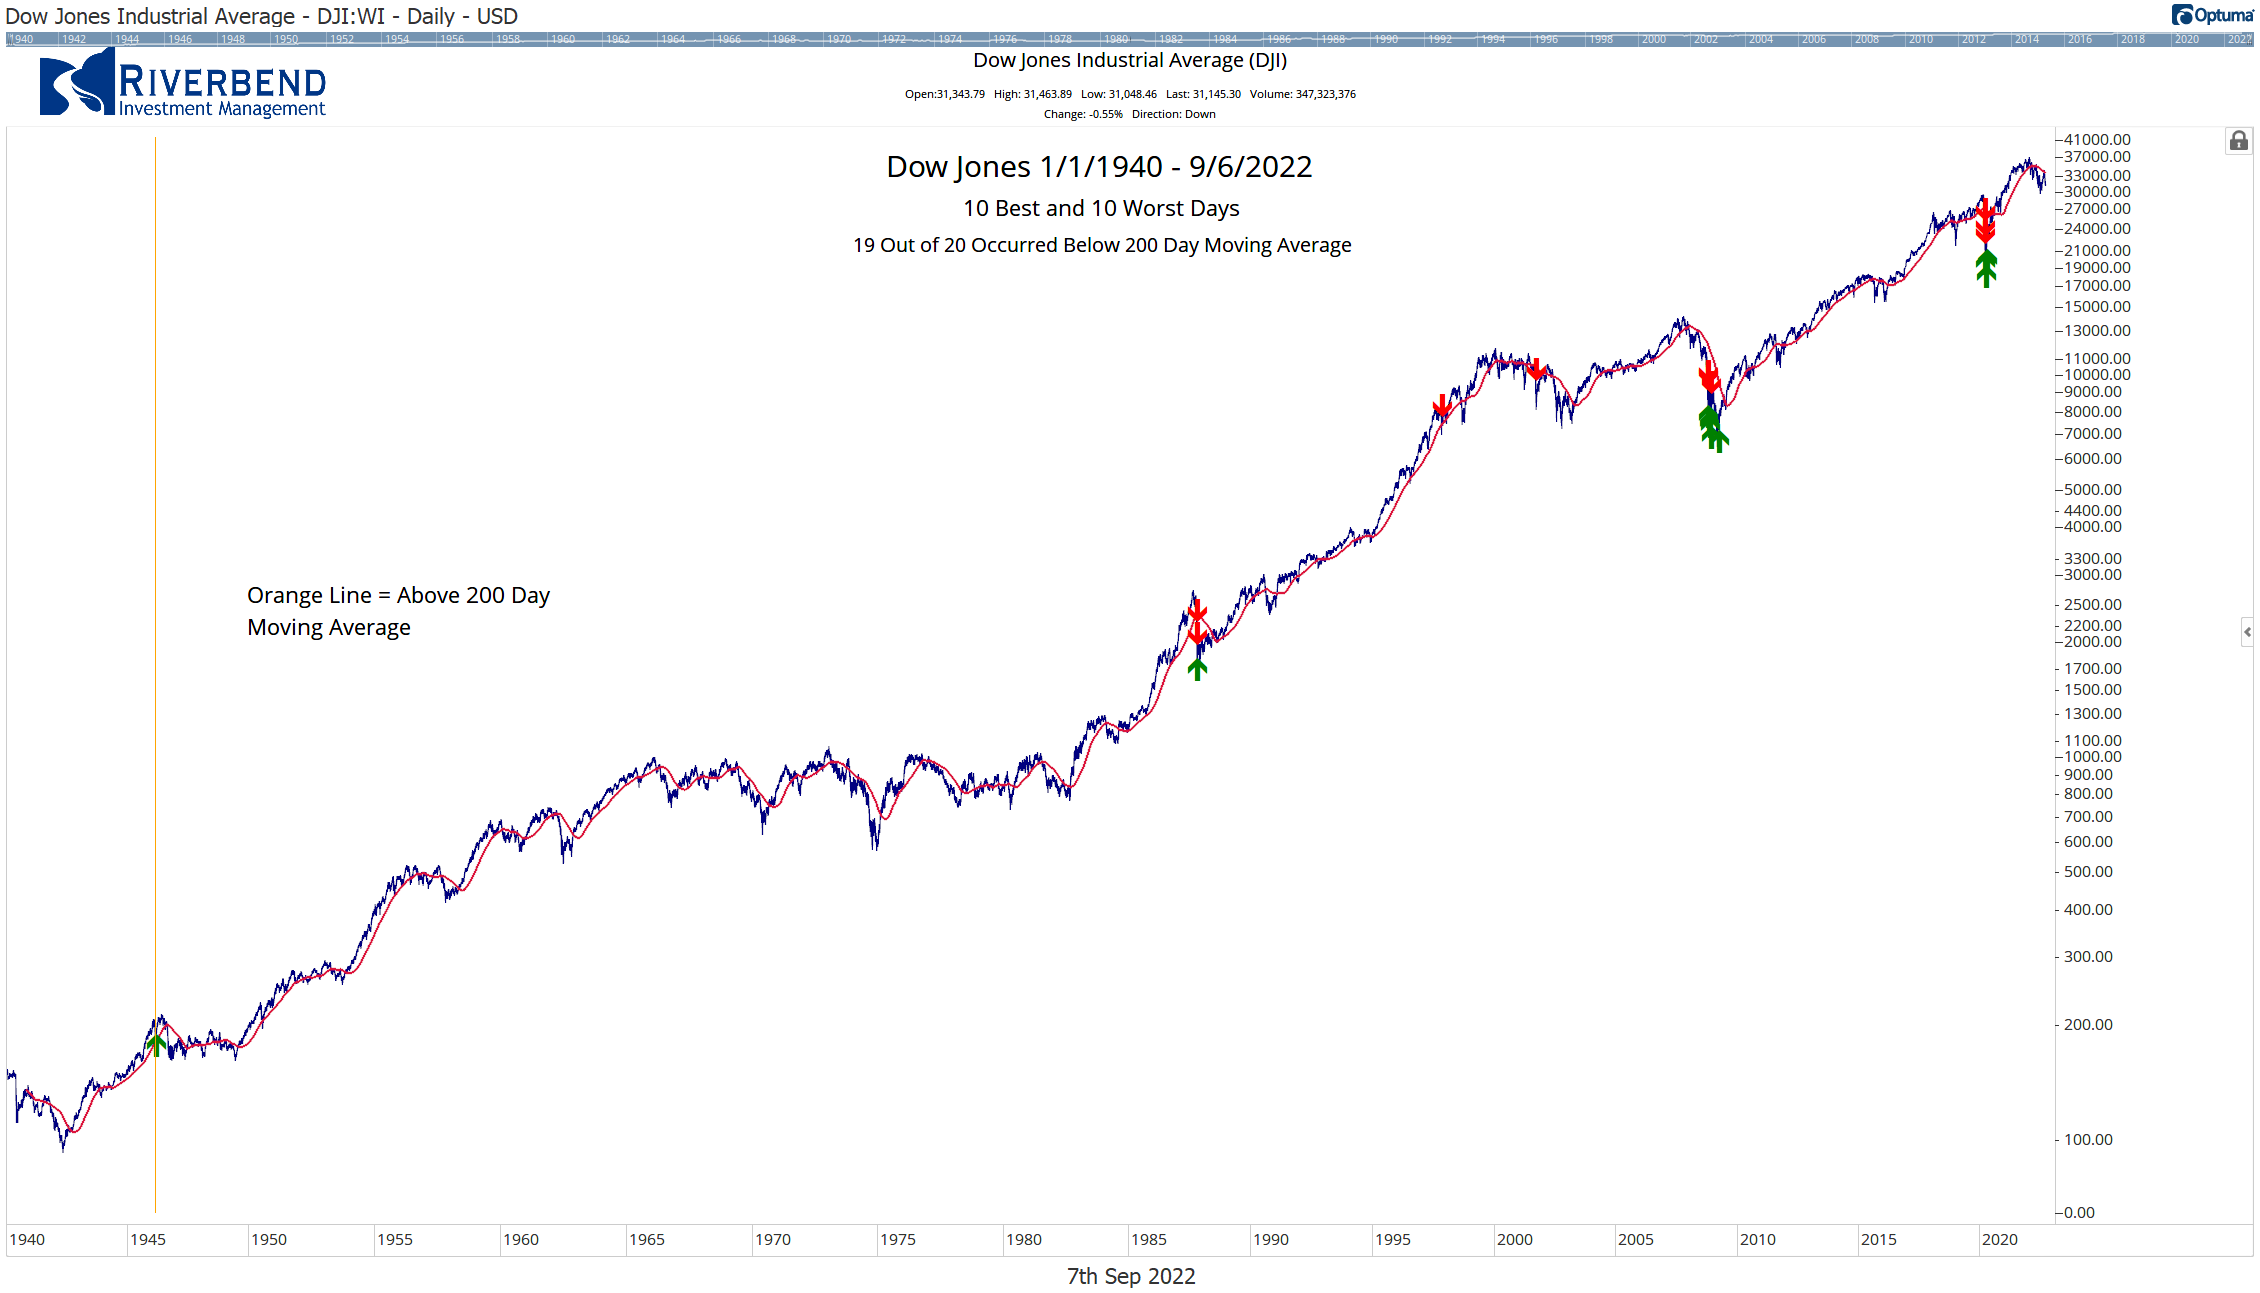
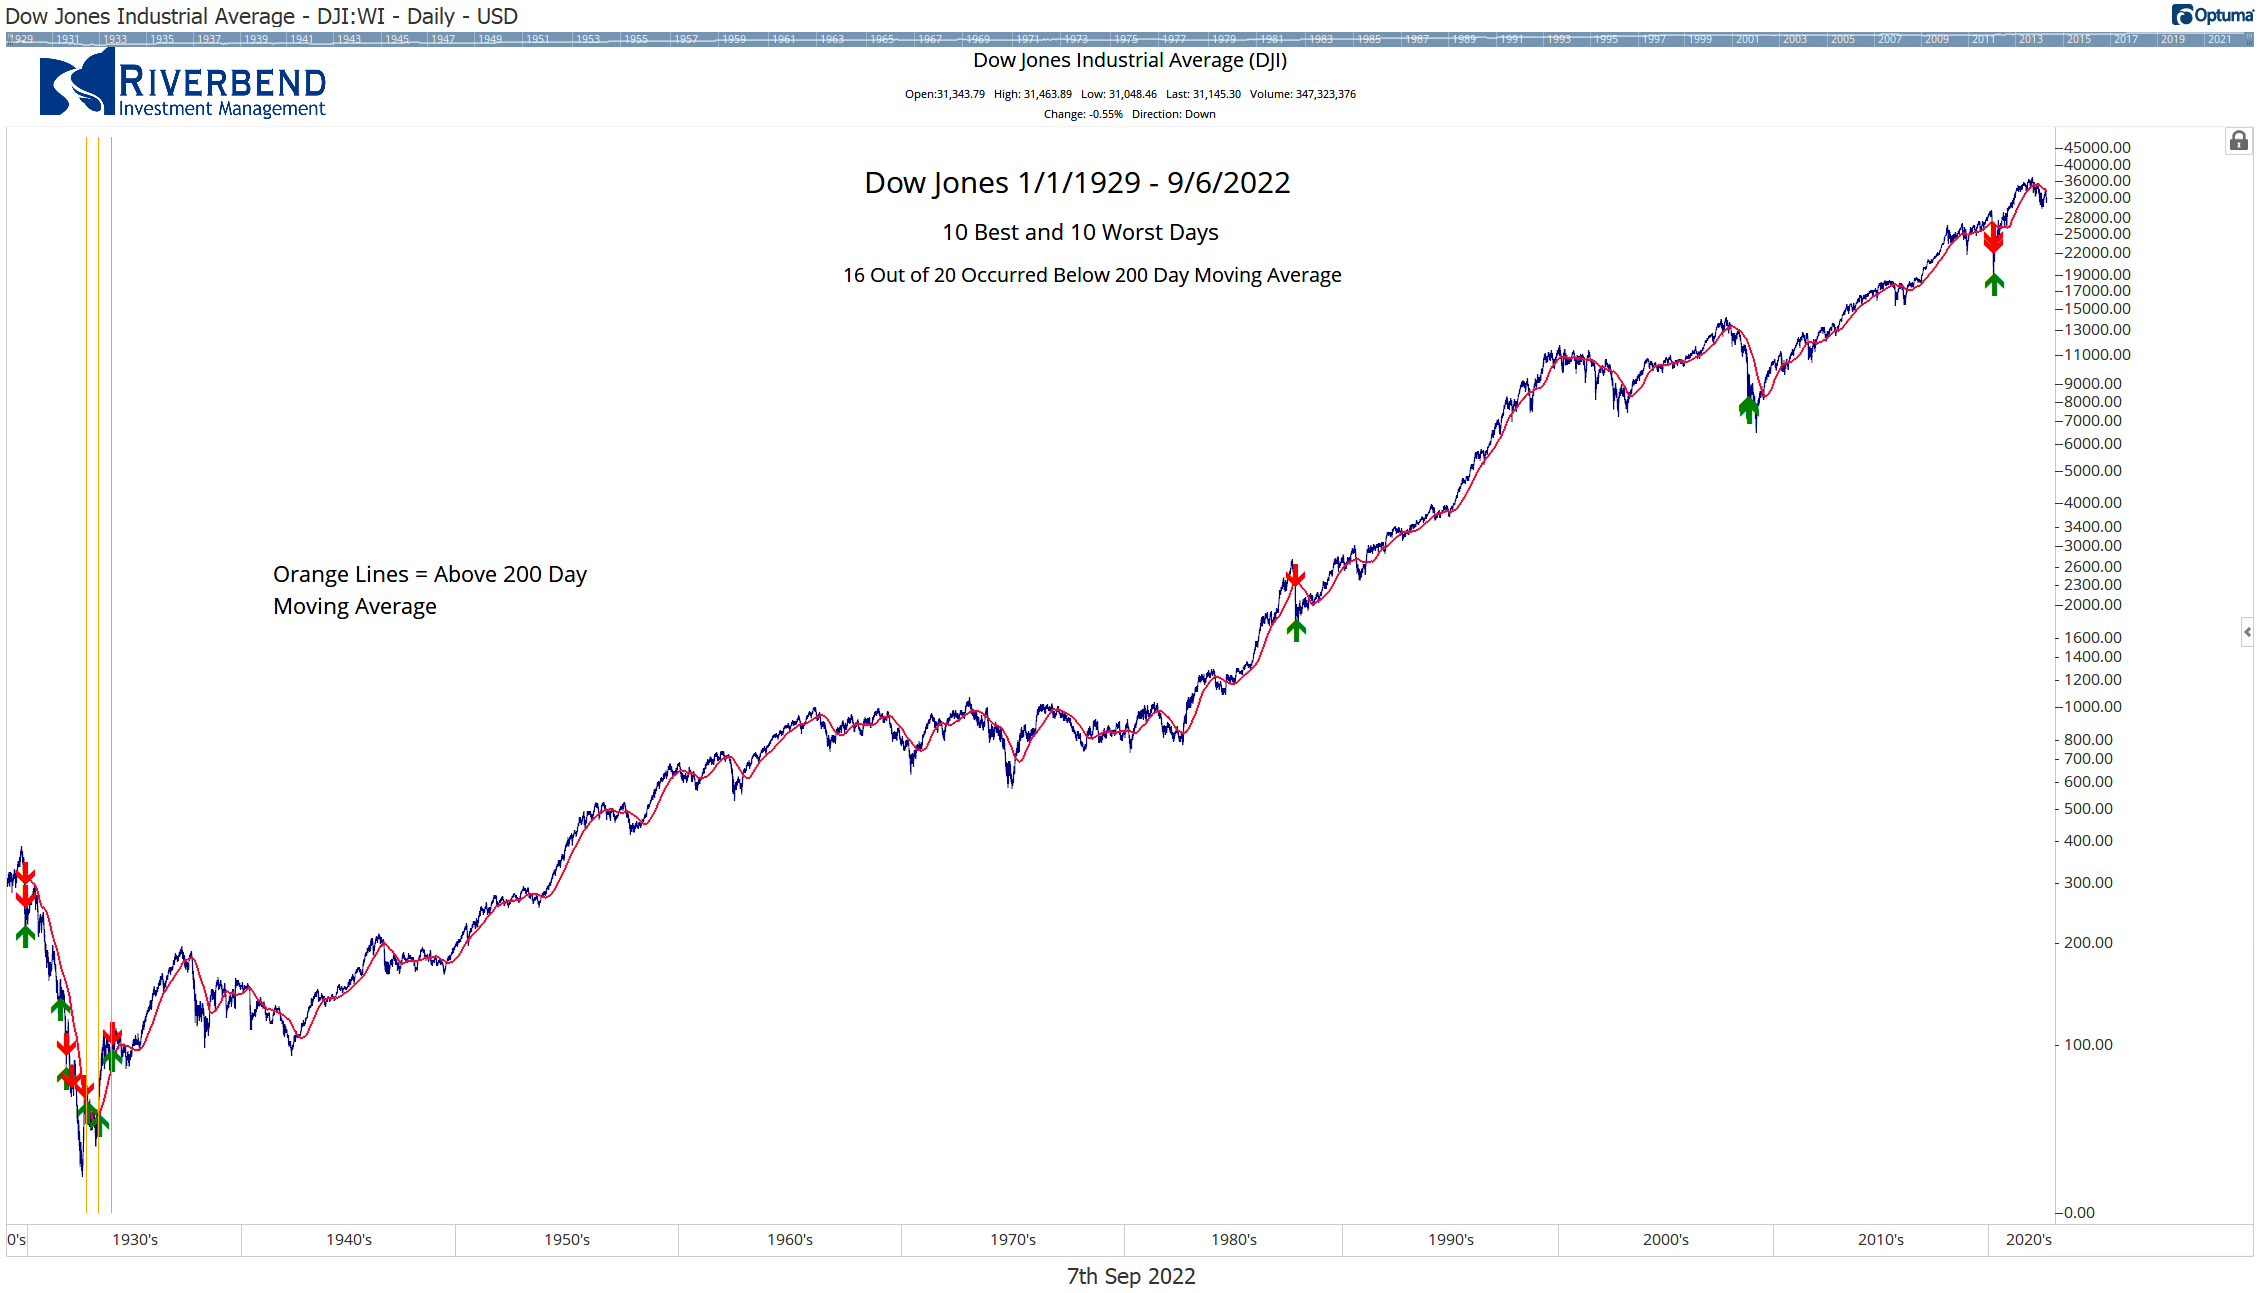
Below is the Dow Jones Index going back to January 1, 1929. The red arrows represent the 10 worst days and the green arrows are the 10 best days.
The orange vertical lines are the times when one of these 10 best/worst days occurred ABOVE the 200-day moving average:
16 out of 20 days occurred below the 200-day moving average. All occurring in the 1930s
If we move ahead to a more “modern” time and use the 1940s as a starting point, 19 out of 20 best and worst days occur below the 200-day moving average:
For investors looking for a way to better manage risk in their portfolio, using a 200-day moving average as an exit signal may add a layer of protection and allow them to sleep better at night.
by John Rothe | Investment Research
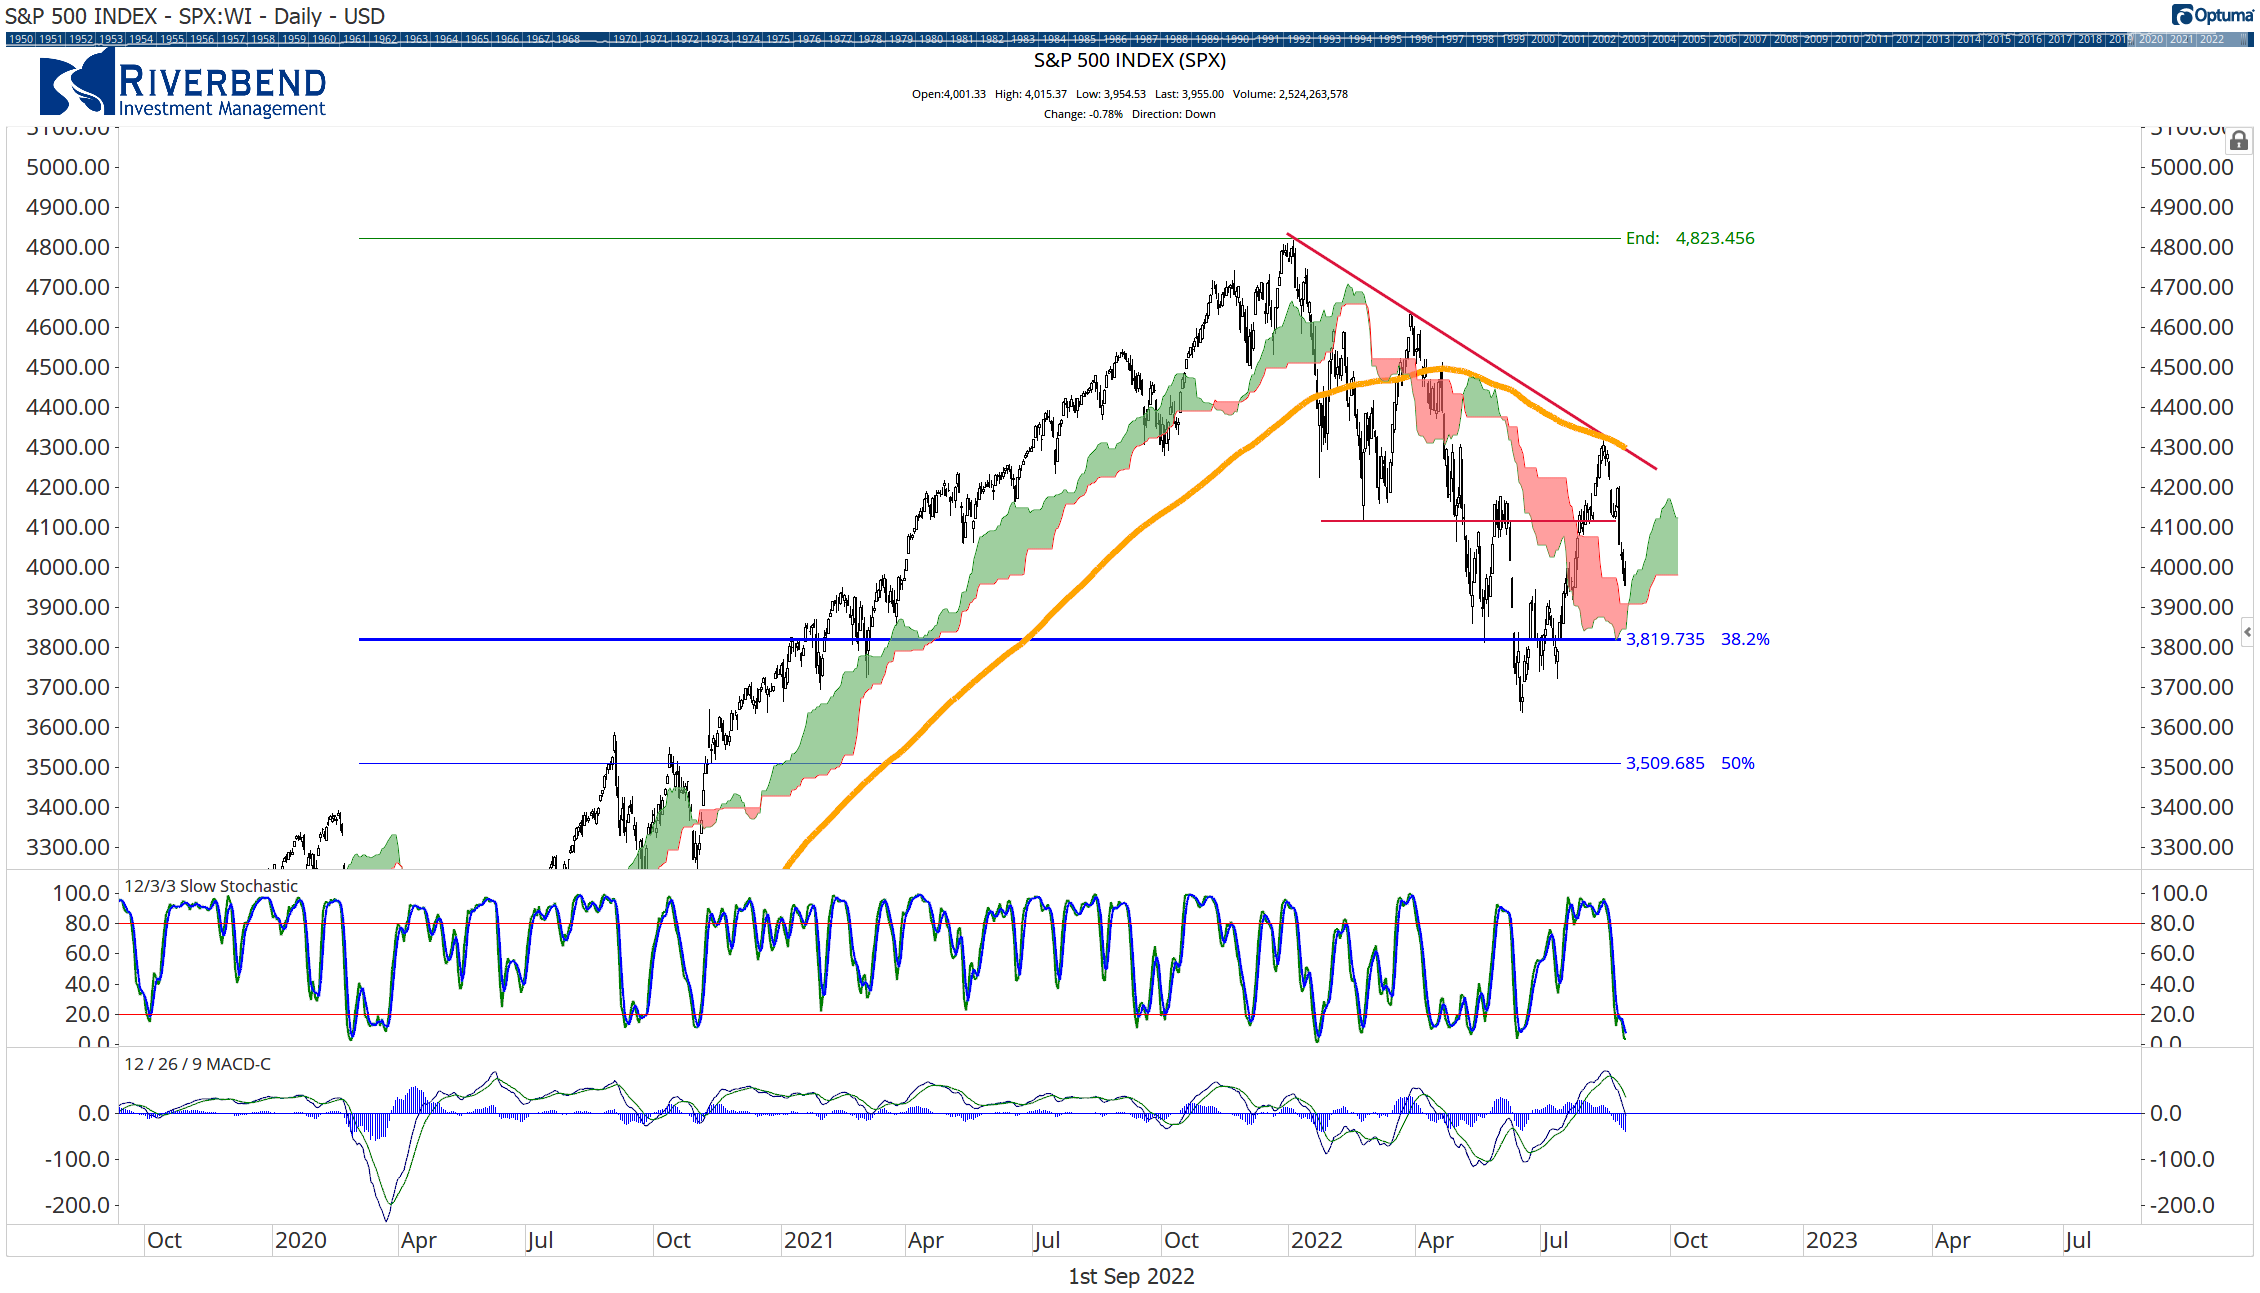
After a quiet June, stock market volatility returned in August. The summer’s counter-trend rally is over and investors are starting to watch some key support levels. A pullback to 38.2% or even 50% Fibonacci levels wouldn’t surprise me as economic data is starting to show the Fed still has a lot of work ahead of itself.
Monthly Market Summary
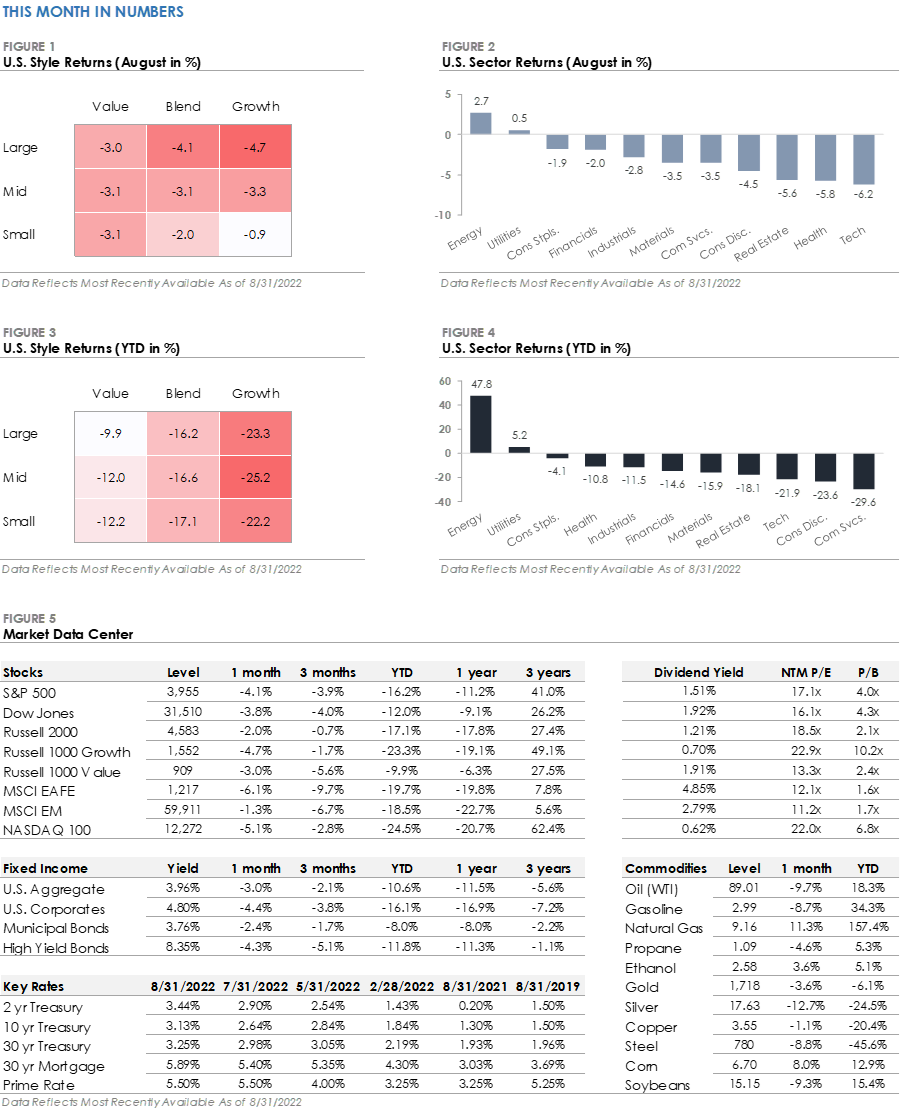
- The S&P 500 Index returned -4.1% during August, underperforming the Russell 2000 Index (-2.0%) for a second consecutive month.
- Energy (+2.7%) was the top-performing S&P 500 sector during August despite oil prices falling -9.7%. Utilities (+0.5%) was the only other sector to produce a positive return. Technology (-6.2%) was the worst performing sector as interest rates rose, followed closely by Health Care (-5.8%) and Real Estate (-5.6%).
- Corporate investment grade bonds generated a -4.4% total return, slightly underperforming corporate high yield bonds’ -4.3% total return.
- The MSCI EAFE Index of global developed market stocks returned -6.1% during August, underperforming the MSCI Emerging Market Index’s -1.3% return.
Stock & Bond Markets Endure a Bumpy August After July’s Gains
The S&P 500 produced a -4.1% return during August, but the headline number doesn’t tell the full story. Equity markets initially rallied during the first half of the month, with the S&P 500 gaining +4.2% through August 16th as July’s market rally continued.
However, the second half of August marked a sharp reversal as the S&P 500’s gave back all its gains plus more. Credit markets also experienced a reversal during August as interest rates reversed higher and bonds produced negative returns.
The increased volatility across stock and bond markets is being attributed to a wide range of investor views creating a tug of war effect in markets, as well as uncertainty regarding how long the Federal Reserve will continue to raise interest rates.
Federal Reserve Chair Pushes Back Against Hopes for Policy Pivot
Reducing inflation is likely to require a sustained period of below-trend growth … [and] will also bring some pain to households and businesses.
The Federal Reserve held its annual August Jackson Hole meeting, and Chair Powell used his speech to forcefully push back against the notion the Fed will pivot and cut interest rates if economic data starts to weaken.
Powell emphasized the central bank’s “overarching focus right now is to bring inflation back down to our 2 percent goal” and cautioned, “Reducing inflation is likely to require a sustained period of below-trend growth … [and] will also bring some pain to households and businesses.”
Investor hopes for a Fed pivot were one of the primary catalysts that propelled the stock market higher during July and August. Chair Powell’s speech dashed those hopes and sent the S&P 500 down more than -3% on the day of his speech.
Why?
Two lines from Chair Powell’s speech underscore the Fed’s goal, “There is clearly a job to do in moderating demand to better align with supply. We are committed to doing that job.” This focus on lowering demand for goods and services may increase portfolio volatility during the months ahead as investors debate how long it will take the Fed to achieve its goal and the impact tighter policy will have on the economy.
by John Rothe | Economic Research
[fusion_builder_container type=”flex” hundred_percent=”no” equal_height_columns=”no” menu_anchor=”” hide_on_mobile=”small-visibility,medium-visibility,large-visibility” class=”” id=”” background_color=”” background_image=”” background_position=”center center” background_repeat=”no-repeat” fade=”no” background_parallax=”none” parallax_speed=”0.3″ video_mp4=”” video_webm=”” video_ogv=”” video_url=”” video_aspect_ratio=”16:9″ video_loop=”yes” video_mute=”yes” overlay_color=”” video_preview_image=”” border_color=”” border_style=”solid” padding_top=”” padding_bottom=”” padding_left=”” padding_right=””][fusion_builder_row][fusion_builder_column type=”1_1″ layout=”1_1″ background_position=”left top” background_color=”” border_color=”” border_style=”solid” border_position=”all” spacing=”yes” background_image=”” background_repeat=”no-repeat” padding_top=”” padding_right=”” padding_bottom=”” padding_left=”” margin_top=”0px” margin_bottom=”0px” class=”” id=”” animation_type=”” animation_speed=”0.3″ animation_direction=”left” hide_on_mobile=”small-visibility,medium-visibility,large-visibility” center_content=”no” last=”true” min_height=”” hover_type=”none” link=”” border_sizes_top=”” border_sizes_bottom=”” border_sizes_left=”” border_sizes_right=”” first=”true”][fusion_text]
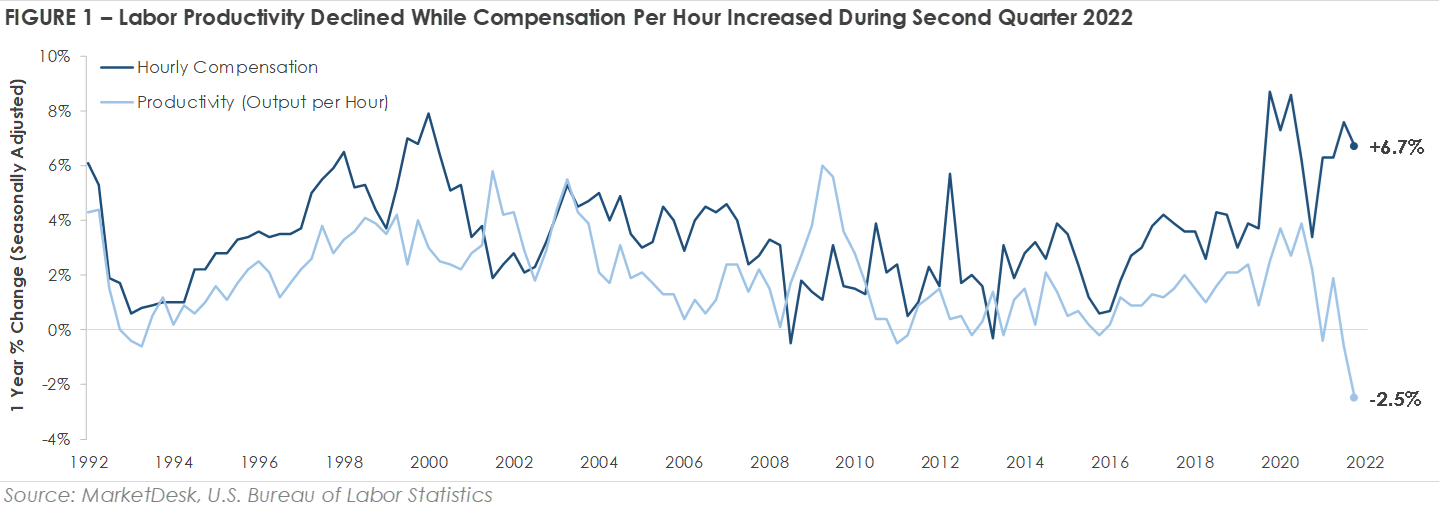
The US economy is facing a trend not seen in decades – declining labor productivity and rising labor costs. Figure 1 shows labor productivity, which is measured as economic output per hour worked, declined -2.5% year-over-year during the second quarter. The -2.5% decline in labor productivity is the largest decline in the data series, which began in the first quarter of 1948. Hourly compensation rose +6.7% year-over-year as a tight labor market drove strong wage growth.
A look at the underlying data provides additional context on declining productivity. Total output rose +1.5% compared to the same quarter a year ago, while hours worked rose a bigger +4.1% year-over-year. The data indicates workers produced more goods and services less efficiently. Why is productivity declining? One potential explanation is pandemic-related themes, such as remote work and inflation, make the process of measuring productivity more difficult and distort the data.
Thematic changes may also explain the productivity decline. The labor market experienced significant turnover during the pandemic, and it takes time for workers to learn new jobs. As an example, Delta’s CEO pointed to labor turnover as a cause of the airline’s recent operational issues: “Since the start of 2021, we’ve hired 18,000 new employees, and our active head count is at 95% of 2019 levels, despite only restoring less than 85% of our capacity. The chief issue we’re working through is not hiring, but of training and experience bubble.”
In addition, capacity constraints may also be weighing on productivity. The capacity utilization rate, which measures the amount of potential output that is actually being realized, was 80% during June 2022. The peak utilization rate over the past 20 years was ~81%, suggesting businesses may be running up against the limit of how much capacity they can use efficiently.
The combination of declining productivity and rising compensation costs is a notable trend, and it remains to be seen whether it is a short-term phenomenon or start of a longer-term trend. One trend we will be monitoring in coming quarters is whether decreased efficiency and rising labor costs negatively impact profit margins.
[/fusion_text][/fusion_builder_column][/fusion_builder_row][/fusion_builder_container]