
The 10-Year vs. 2-Year Treasury Bond Spread: Implications for the Economy and the U.S. Stock Market

The 10-Year vs. 2-Year Treasury Bond Spread: Implications for the Economy and the U.S. Stock Market
In the vast spectrum of economic indicators, one stands out for its uncanny ability to foreshadow potential downturns — the 10-Year vs. 2-Year Treasury Bond Spread.
Known as the “10-2 spread”, this measure has emerged as a focal point for policymakers, investors, and market watchers.
But what makes this spread so significant? Can it really be a trusted herald of impending recessions?

Relationship between the 2 Year and 10 Year Treasury Bond
An Introduction to the 10-2 Spread
At the foundation, the 10-2 spread is the difference in yields between the U.S. 10-year Treasury bond and the 2-year Treasury bond (1).
A bond’s yield, to put it simply, is the return an investor anticipates when buying a bond. When you map out the yields of Treasury bonds of varying maturities, the resulting graph is the yield curve.
Typically, a 10-year bond offers a higher yield than a 2-year bond because of the longer time frame and associated risks, especially inflation.
Factors Influencing the Spread
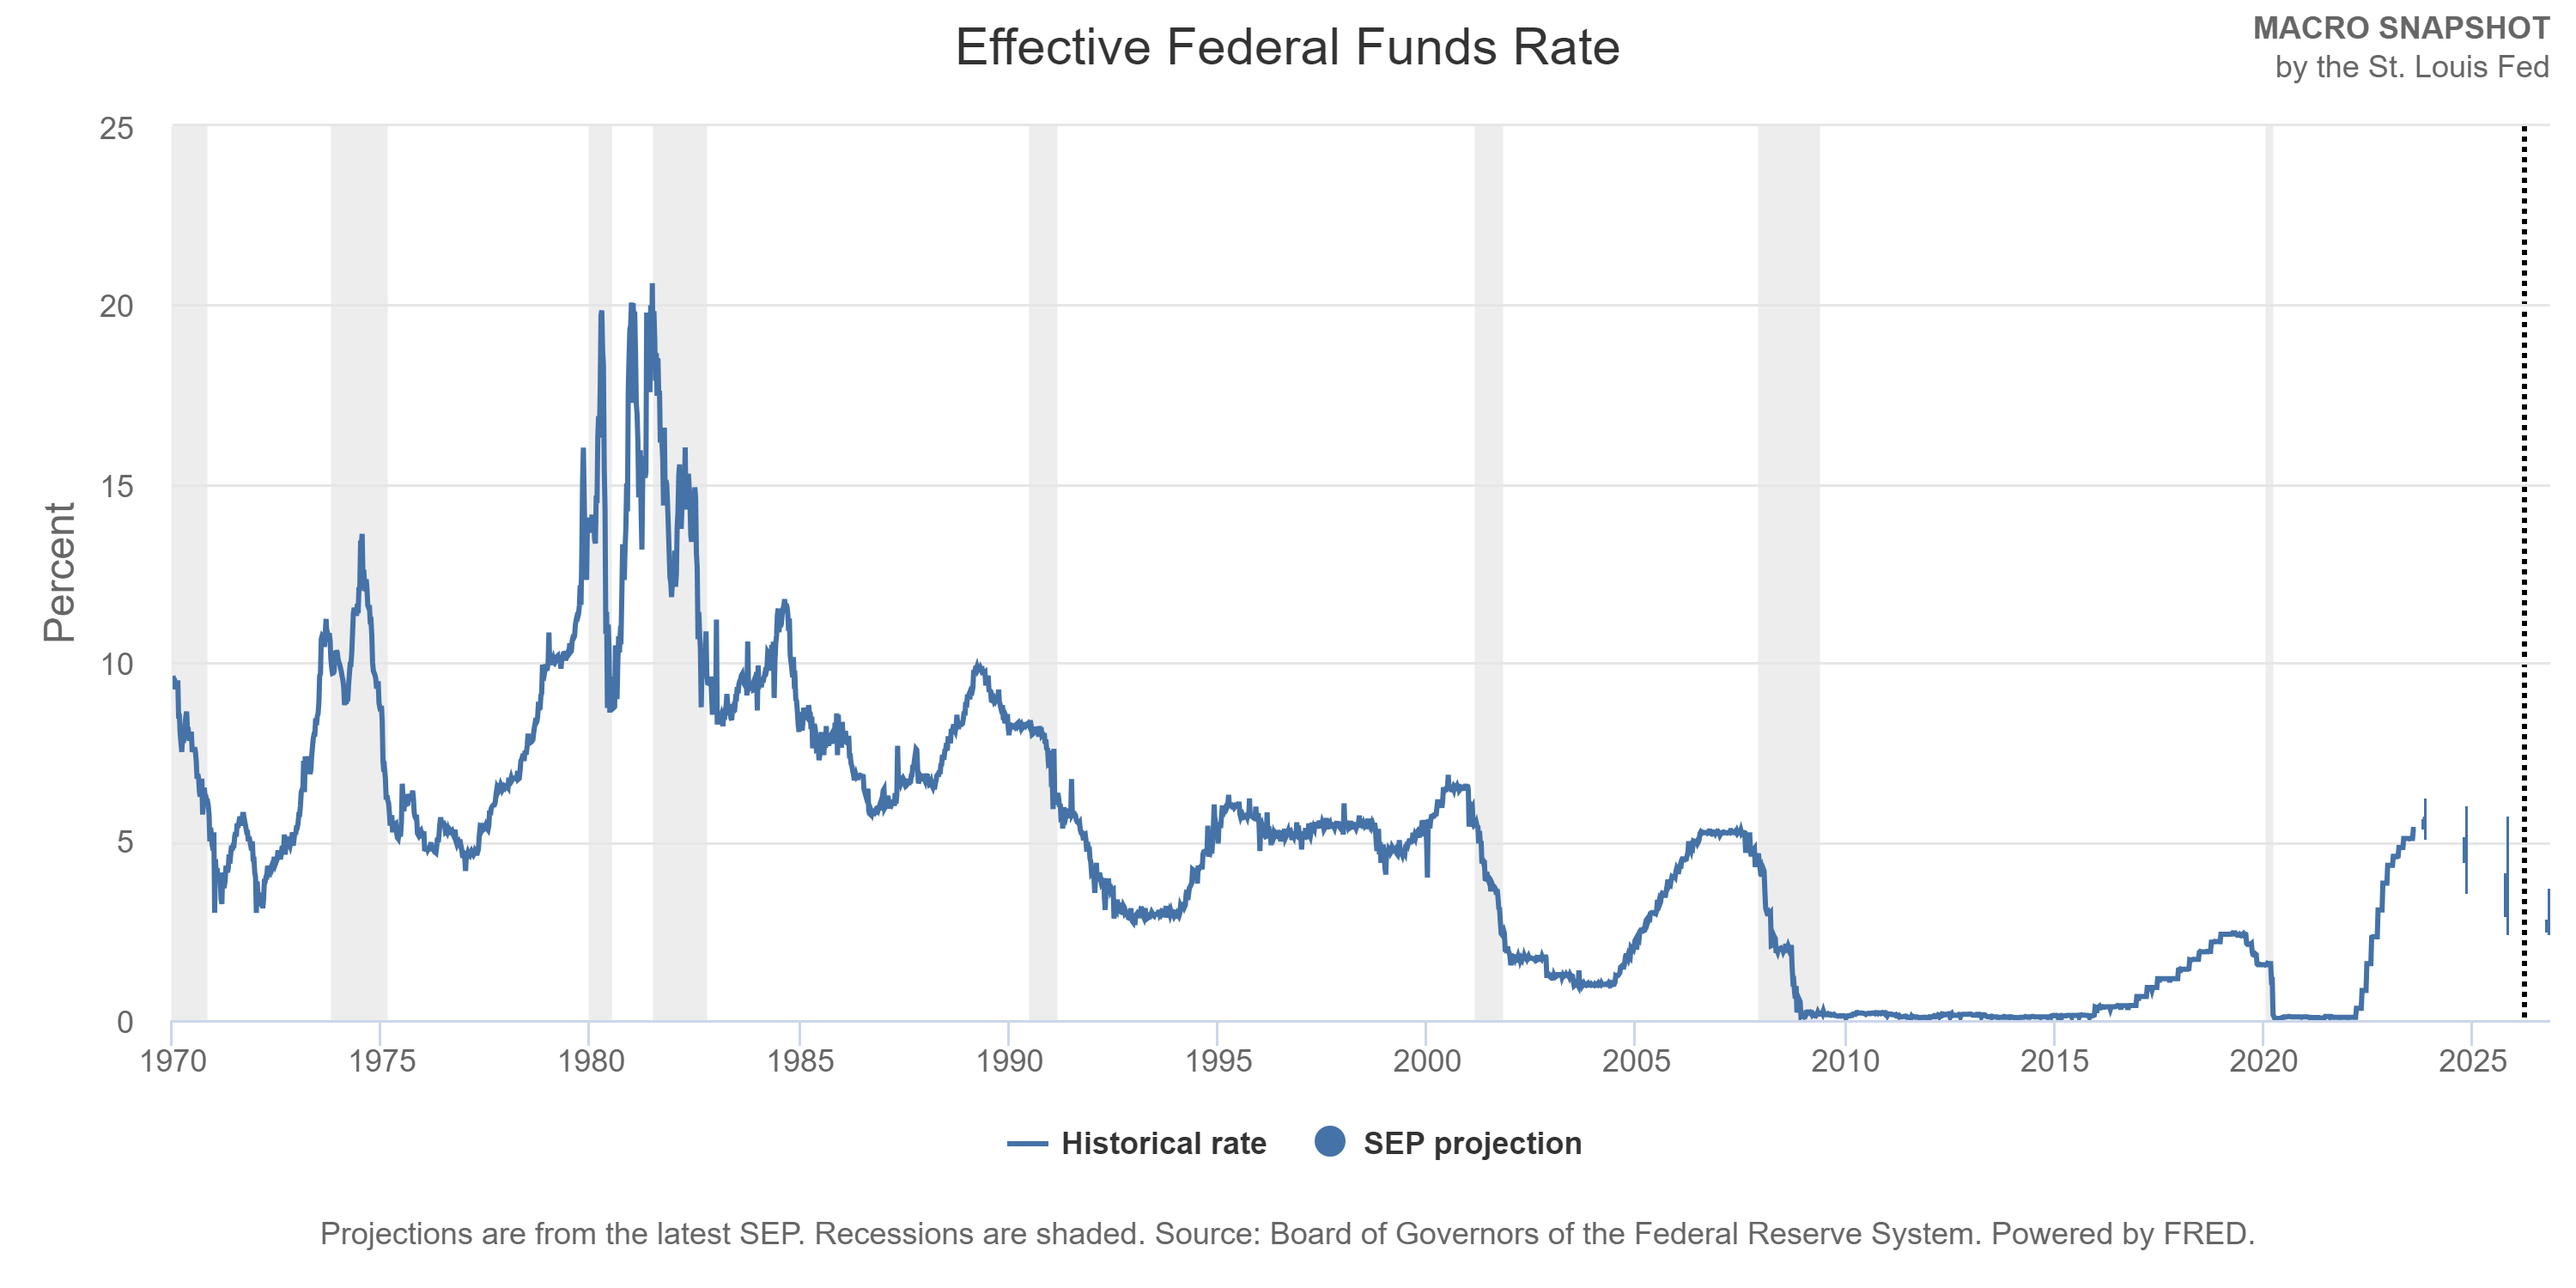
1. Monetary Policy Decisions: The actions of central banks, especially the Federal Reserve in the U.S., play a pivotal role in molding short-term interest rates.
For example, to counteract inflation or an overheating economy, the Fed might decide to hike rates, a move that would likely boost short-term bond yields (2).
2. Investor Sentiment and Behavior: Yields on long-term bonds, such as the 10-year bond, are influenced significantly by investor sentiment about the future.
If the collective market foresees economic headwinds, there might be a rush towards the relative safety of long-term bonds, driving up their prices and consequently pushing down their yields (3).

Source: CNN
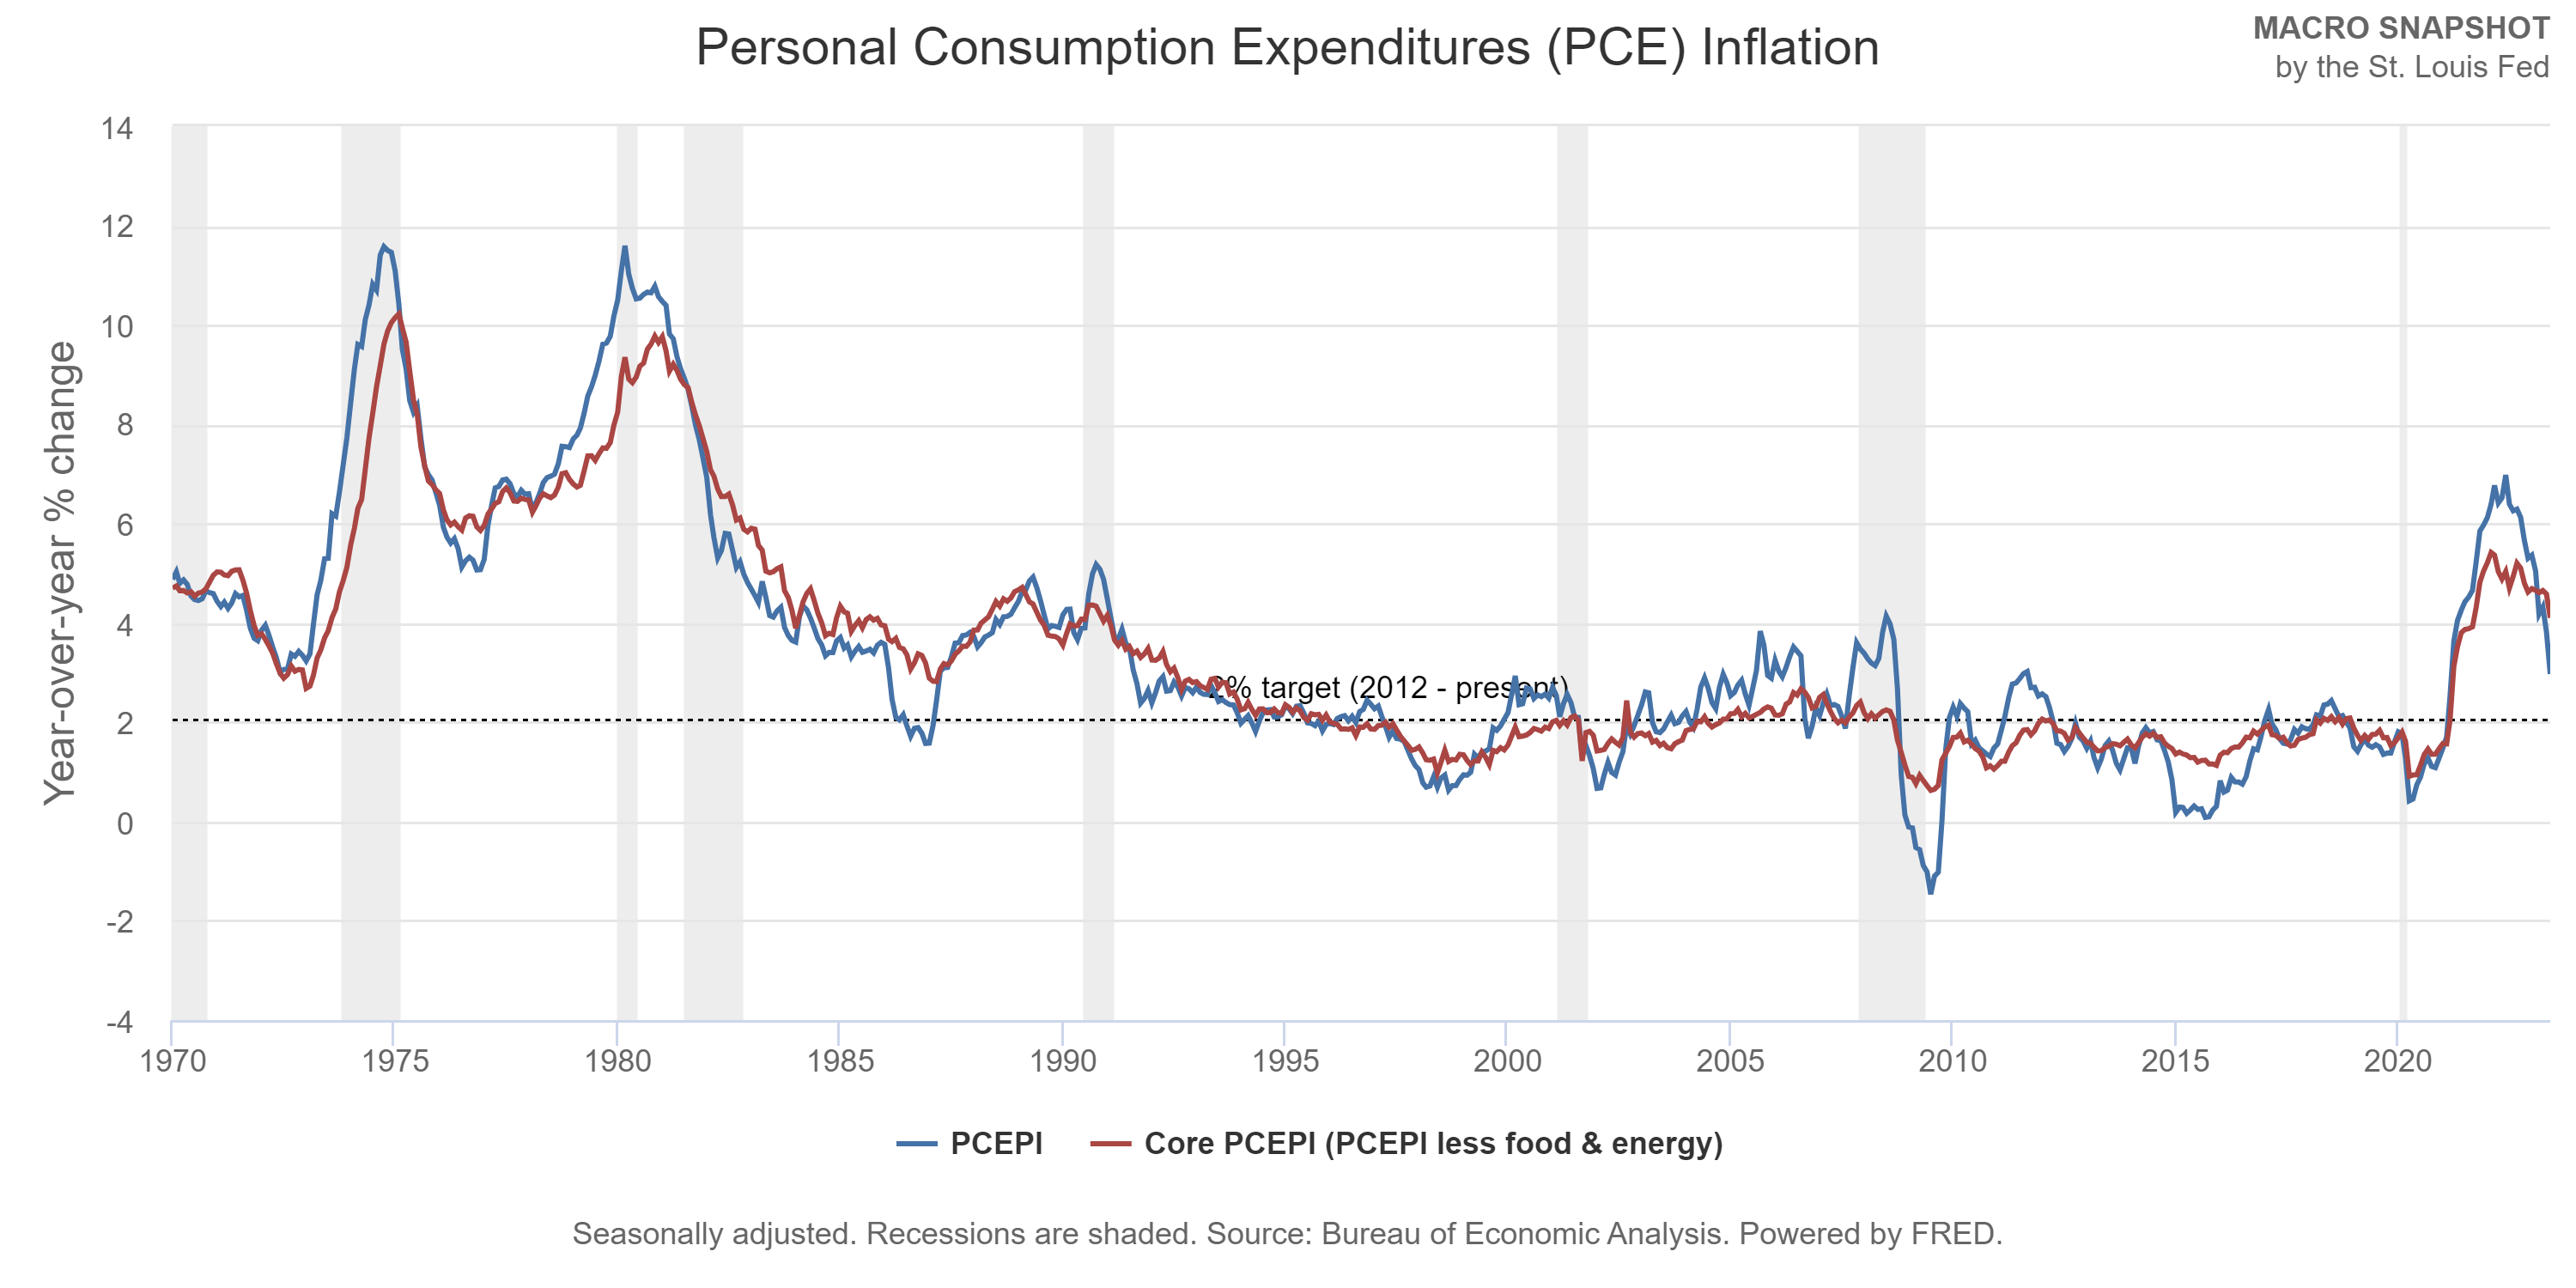
3. Expectations of Future Inflation: The prospect of rising inflation in the future can make investors wary, leading to a demand for higher yields on long-term bonds to compensate for anticipated value erosion (4).
4. Global Economic Dynamics: We live in an interconnected global economy where events in one region can ripple across financial systems worldwide.
Factors like discrepancies in international bond yields and major shifts in global economies can also weigh on the U.S. yield curve.

Source Koyfin
Does the10-Year vs. 2-Year Treasury Bond Spread Predict Recessions?

Historical data provides some compelling evidence. An inverted yield curve—where the yield on the 2-year Treasury bond exceeds the 10-year yield—has been observed before every U.S. recession since the 1960s (5).
This inversion suggests a peculiar phenomenon: investors demonstrate more confidence in the economic outlook over a 2-year horizon than a 10-year one.
However, while history offers insights, it’s imperative to approach the spread with a nuanced perspective:
1. Time Lags and Variances: Post-inversion, the lead time to a recession can be wildly inconsistent. Historical trends show that after the yield curve inverts, it could be anywhere from a few months to over two years before a recession hits (6).
2. Potential False Alarms: Relying solely on the 10-2 spread as a deterministic recession predictor can be a precarious strategy. While it’s a robust indicator, it’s not infallible.
3. A Changing Global Landscape: Modern economies are complex, interconnected webs. International events, from Brexit to the economic policies of major players like China, can impact the U.S. yield curve (7).
4. Structural Market Changes: Over time, market structures evolve, influenced by regulations, technology, and financial innovations. These transformations can sometimes affect how traditional indicators, including the yield curve, behave and should be interpreted.
Implications for Various Stakeholders
For Policymakers
The yield curve, specifically the 10-Year vs. 2-Year Treasury Bond spread, provides policymakers with valuable feedback on the efficacy of their strategies (8).
An inverted curve might suggest that monetary policies need to be re-evaluated.
For Investors
The 10-2 spread is more than just a metric—it’s a sentiment barometer. Active portfolio adjustments in anticipation of potential economic shifts can be informed by movements in this spread (9).
For Economists
The spread offers a treasure trove of data, acting as a litmus test for the economy’s health and providing insights into the interplay of various macroeconomic factors.
Conclusions and Forward Outlook
In the sophisticated dance of economic indicators, the 10-2 Treasury bond spread certainly plays a pivotal role. While its historical track record is impressive, relying solely on it for economic forecasting can be misleading.
A holistic approach—one that takes into account myriad factors, both domestic and global, and understands the intricacies and potential anomalies of the spread—is the optimal strategy.
In this intricate game of economic prediction, the 10-Year vs. 2-Year Treasury Bond Spread is undeniably a powerful player, but it’s crucial to remember that it’s just one of many on the field.
Sources
1: U.S. Department of the Treasury. “Daily Treasury Yield Curve Rates.”
2: Federal Reserve Bank of St. Louis. “The Role of Monetary Policy in Interest Rate Determination.”
3: Investopedia. “Determinants of Interest Rates and Bond Yields.”
4: Federal Reserve Bank of Cleveland. “Analyzing Inflation’s Impact on Bond Yields.”
5: National Bureau of Economic Research. “Linking Yield Curve Inversions and Economic Downturns.”
6: The Financial Times. “The Complex Relationship Between Yield Curve Inversions and Economic Recessions.”
7: The Wall Street Journal. “Global Factors Affecting U.S. Yield Curves.”
8: Brookings Institution. “The Yield Curve and Its Policy Implications.”
9: J.P. Morgan Asset Management. “Investing in the Shadow of the Yield Curve.”