Investment Research from John Rothe, CMT
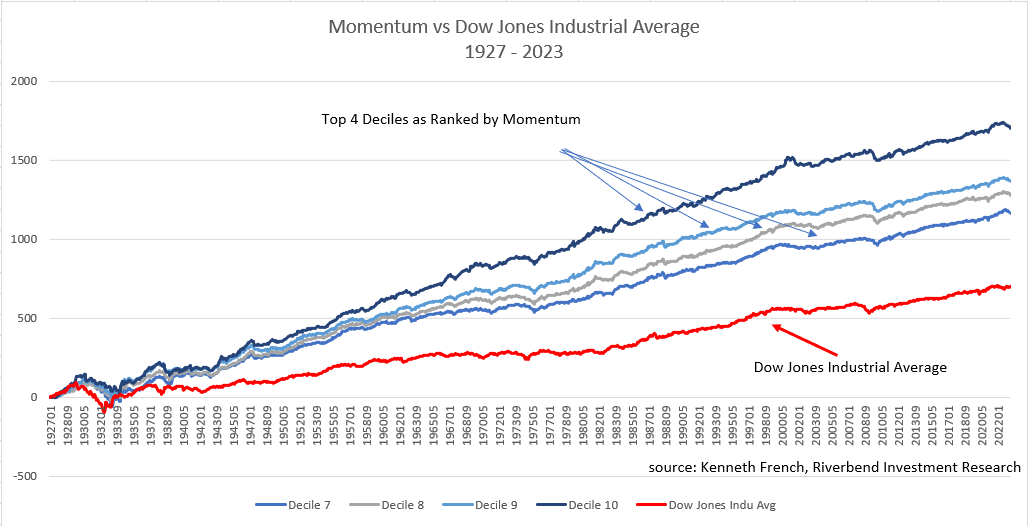
Momentum Investing Research: Harnessing the Power of Market Trends
Momentum investing research has proven momentum strategies that involve purchasing stocks or other securities that have demonstrated high returns over the past three to twelve months while selling those that have had low returns.
This tactic has been leveraged by both professional investors and individual traders for many years, consistently outperforming the stock market. In this article, we will delve into the world of momentum investing research, exploring what it is, how it operates, and why it has been so successful.
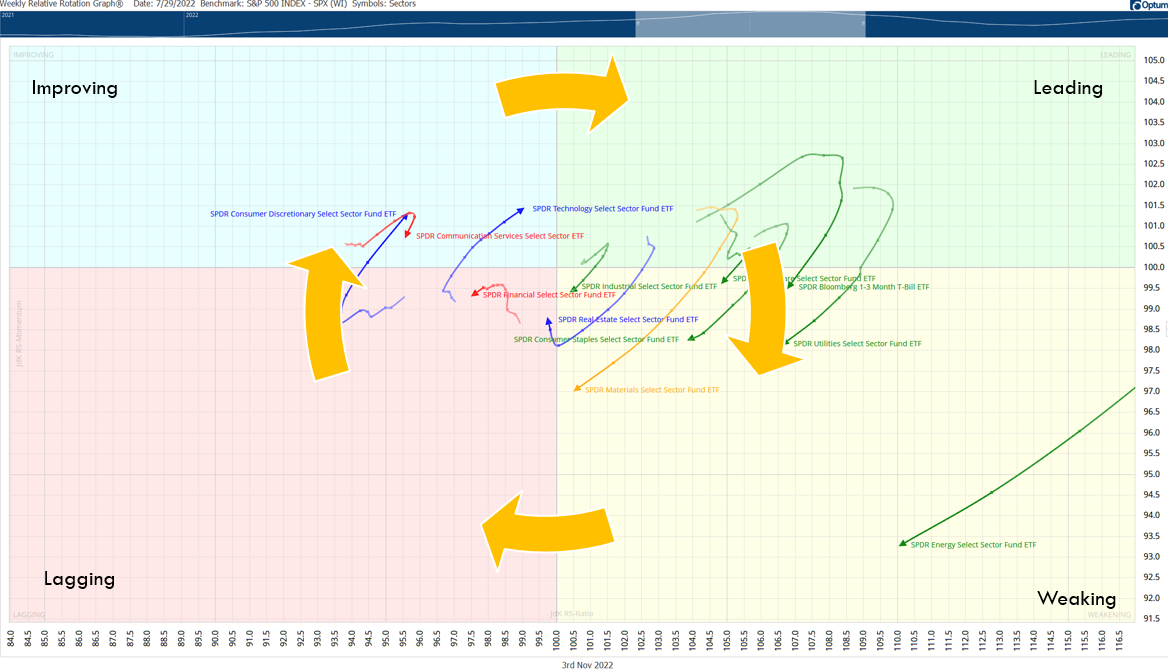
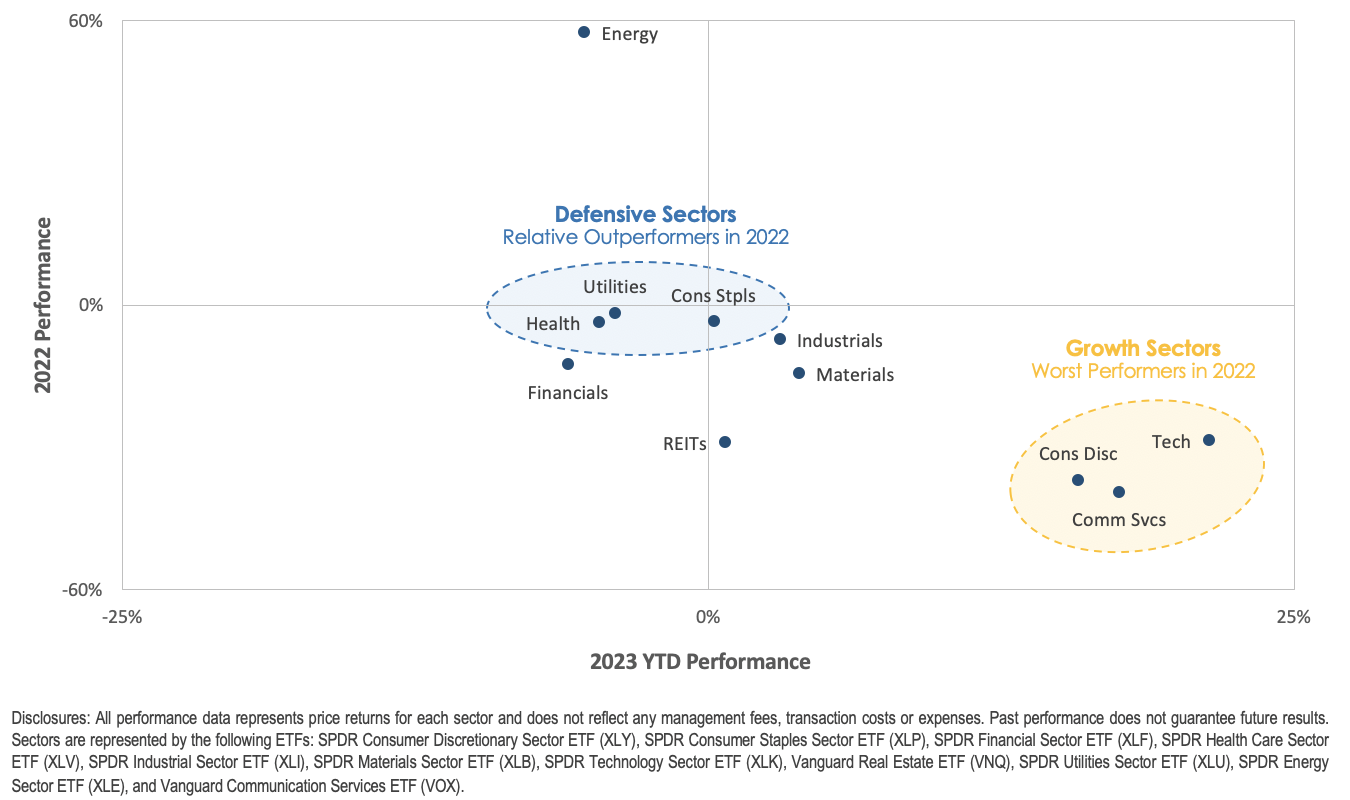
How to Use Relative Rotation Graphs for Selecting the Best Sectors
Relative Rotation Graphs can provide early insight into which sectors are outperforming a particle index, which sectors are strengthening, and which may become leadership areas to focus on. Academic research has shown RRG charts can provide outperformance vs buy and hold investment strategies.
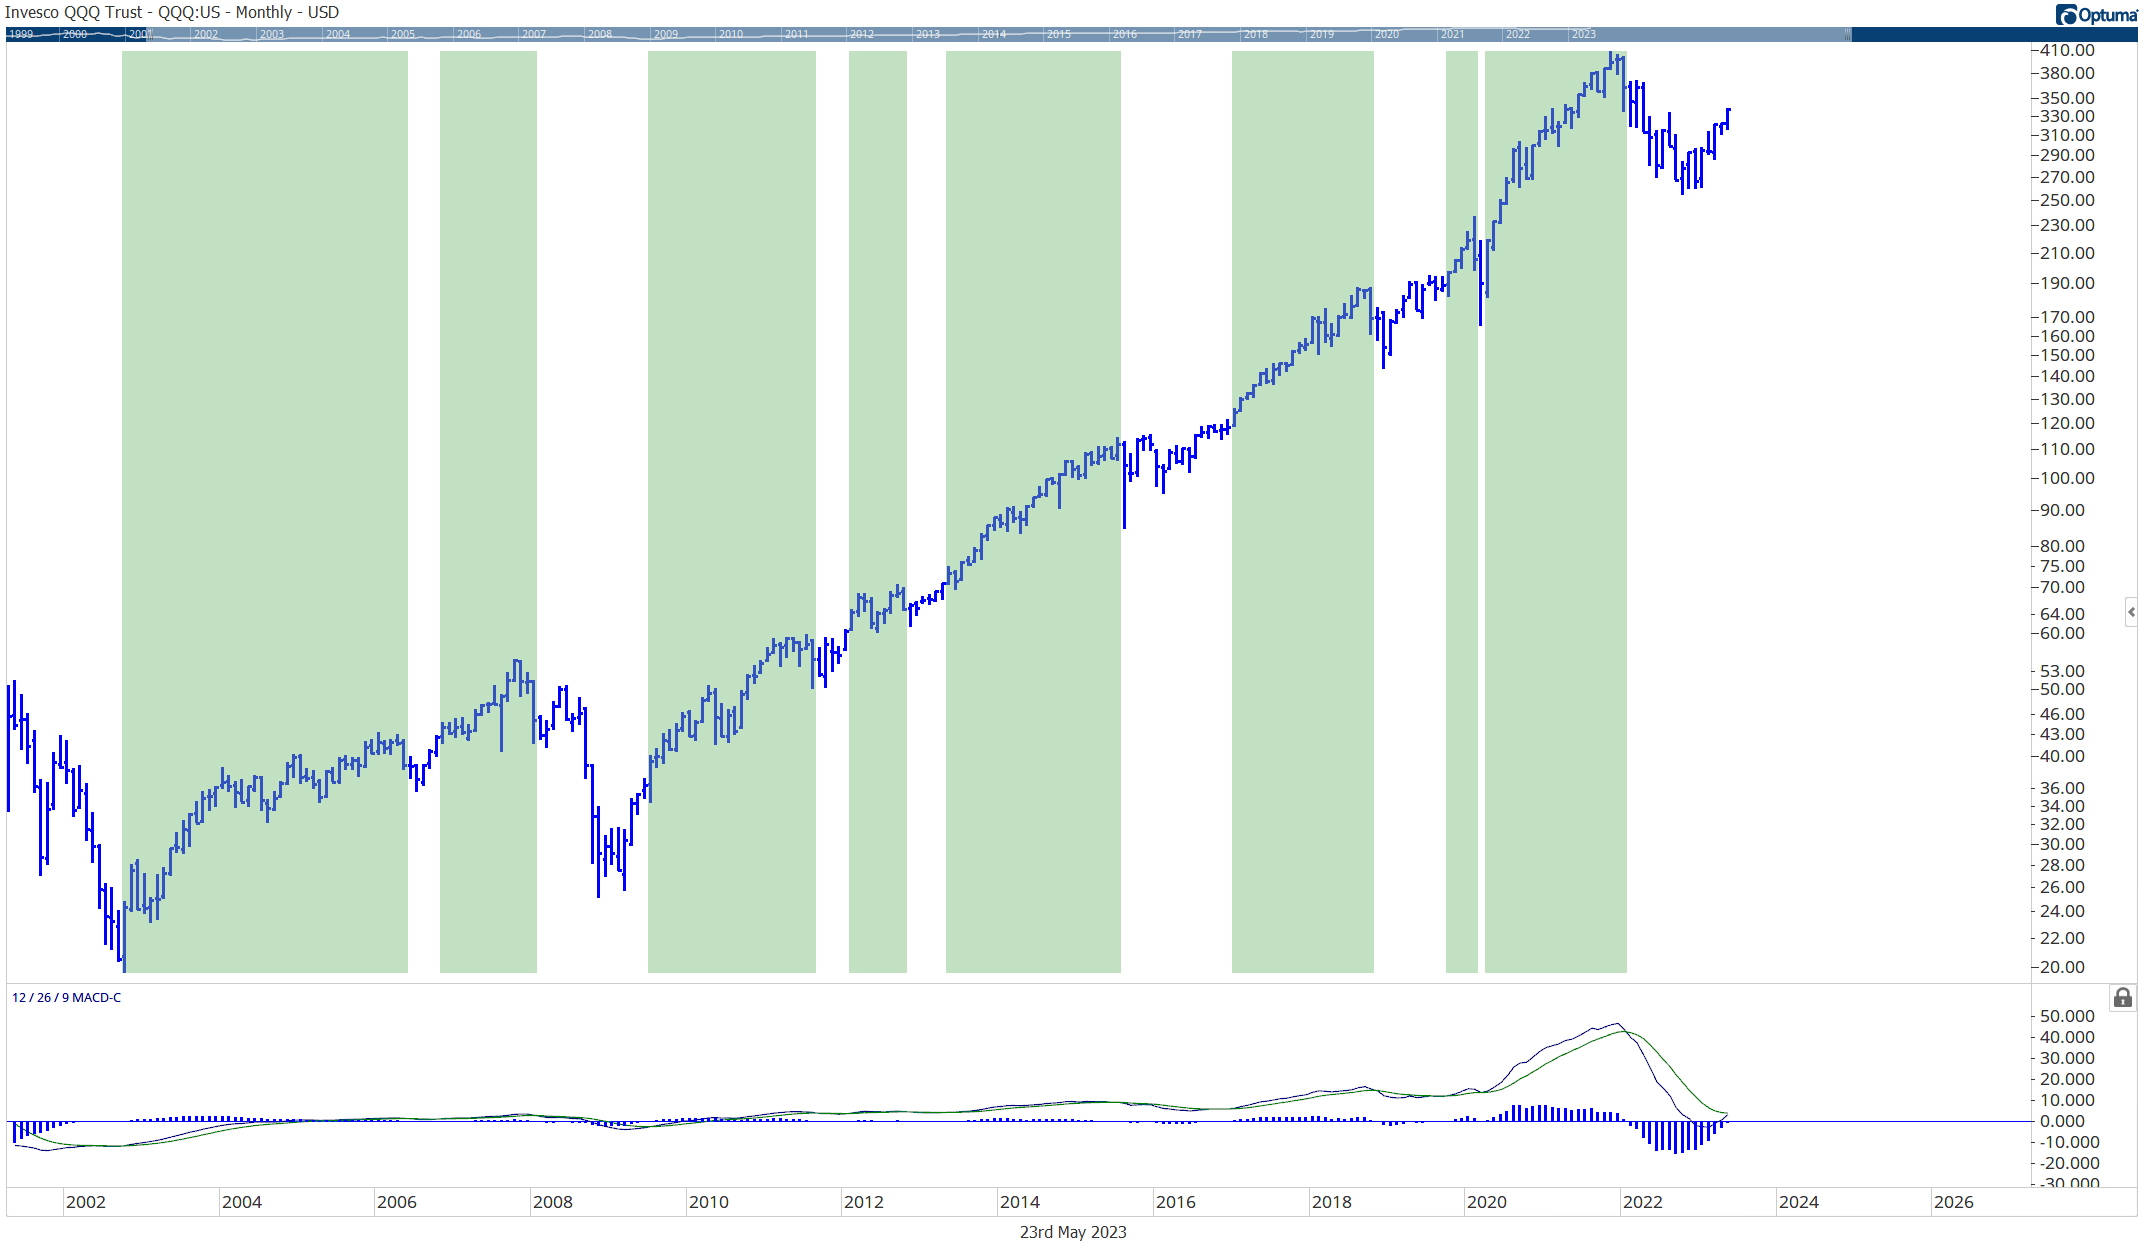
A Major, Long Term MACD Signal is Forming
The popular MACD indicator is nearing a monthly buy signal on the QQQ ETF. We take a look at the historical significance of this and what it may mean for the US stock market going forward.
Economic Headwinds Facing Investors
The stock market had a strong start to 2023, with the S&P 500 finishing January with nearly a 6% gain. However, that trend began to reverse, as investors started to weigh the impact of numerous economic changes and challenges – such as mixed inflation data, bank failures, and a continued shortage of workers.
Investors now need to pay attention to possible economic headwinds that can impact their portfolios.

White Paper: Using Volatility to Add Alpha and Control Portfolio Risk
Volatility is a well-known and widely-studied aspect of financial markets, and has been the focus of numerous academic and industry research efforts over the years. It is widely recognized that volatility can have a significant impact on investment portfolios, and as...
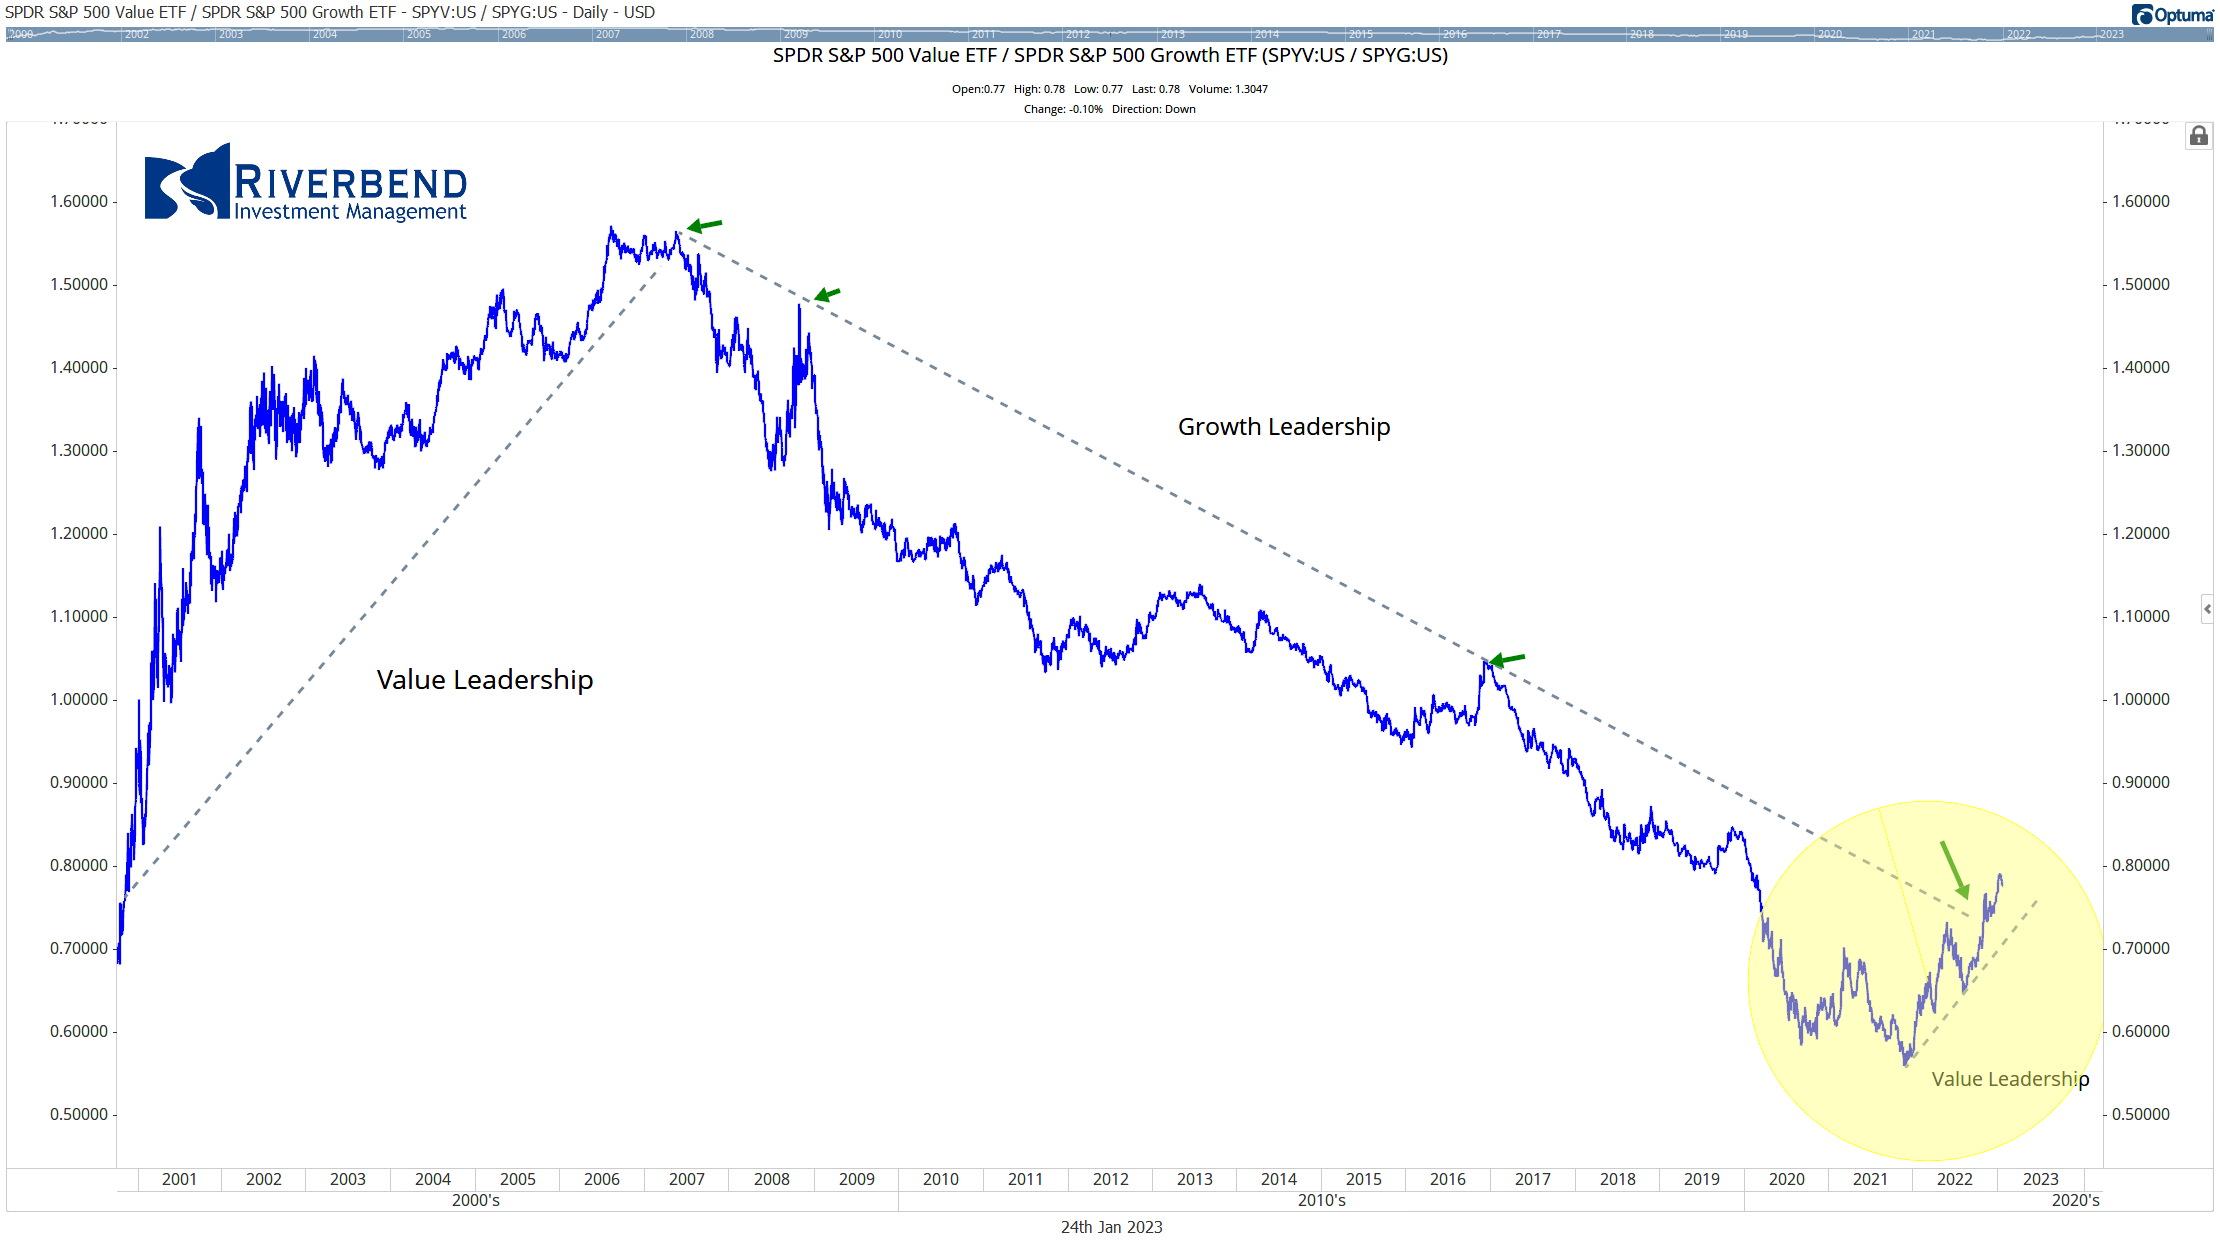
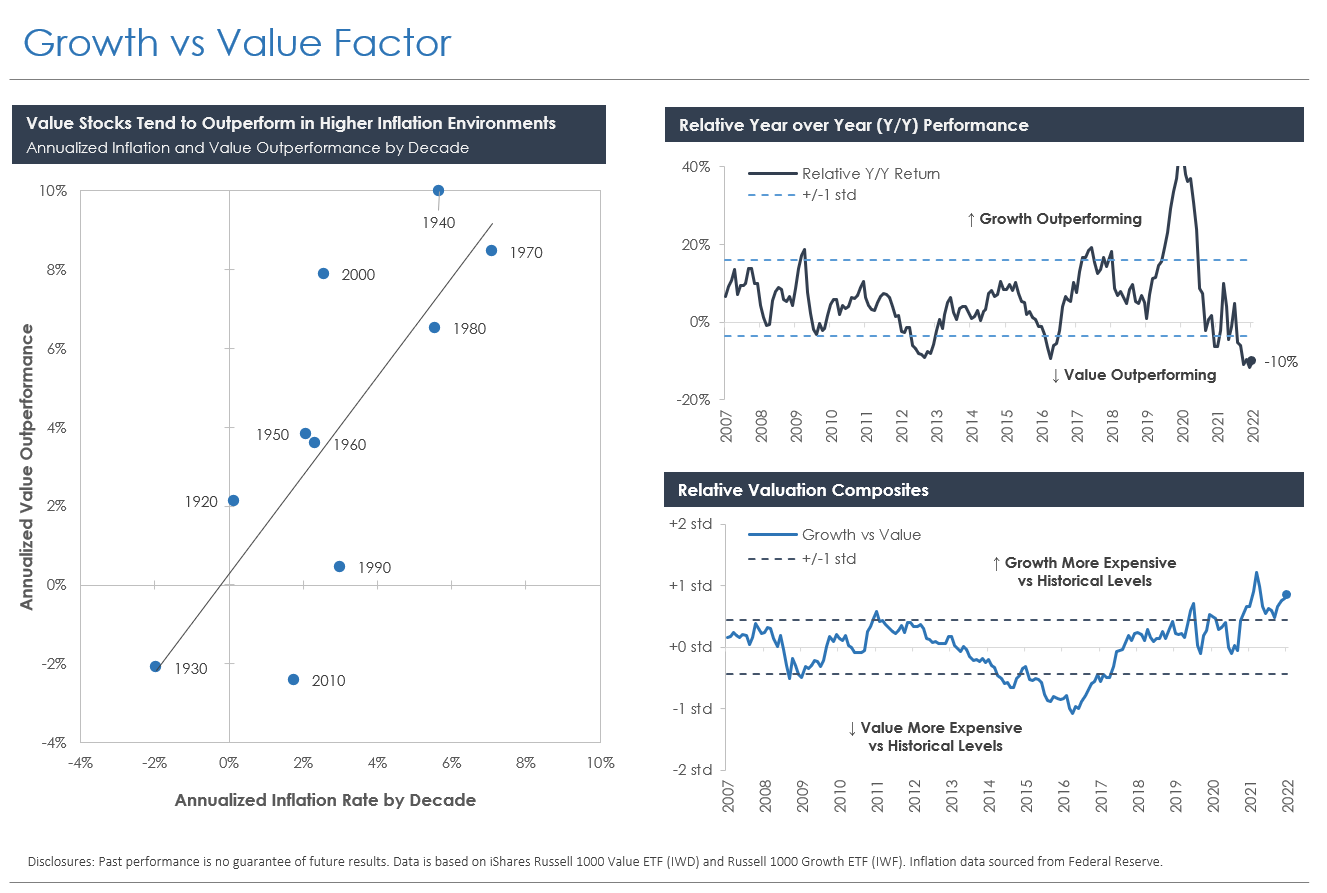
Value vs Growth: Is A Decade of Value Leadership Coming?
Since the November lows, the relationship between Growth and Value names has traded place. If we take a look at the relative strength comparison between S&P 500 Value and S&P 500 Growth, we can see that after the Tech Collapse in 2000-2001, Value stocks outperformed Growth stocks on a relative basis up until the Great Financial Crisis. After 2009, Value underperformed Growth — until the stock market lows in November 2022.
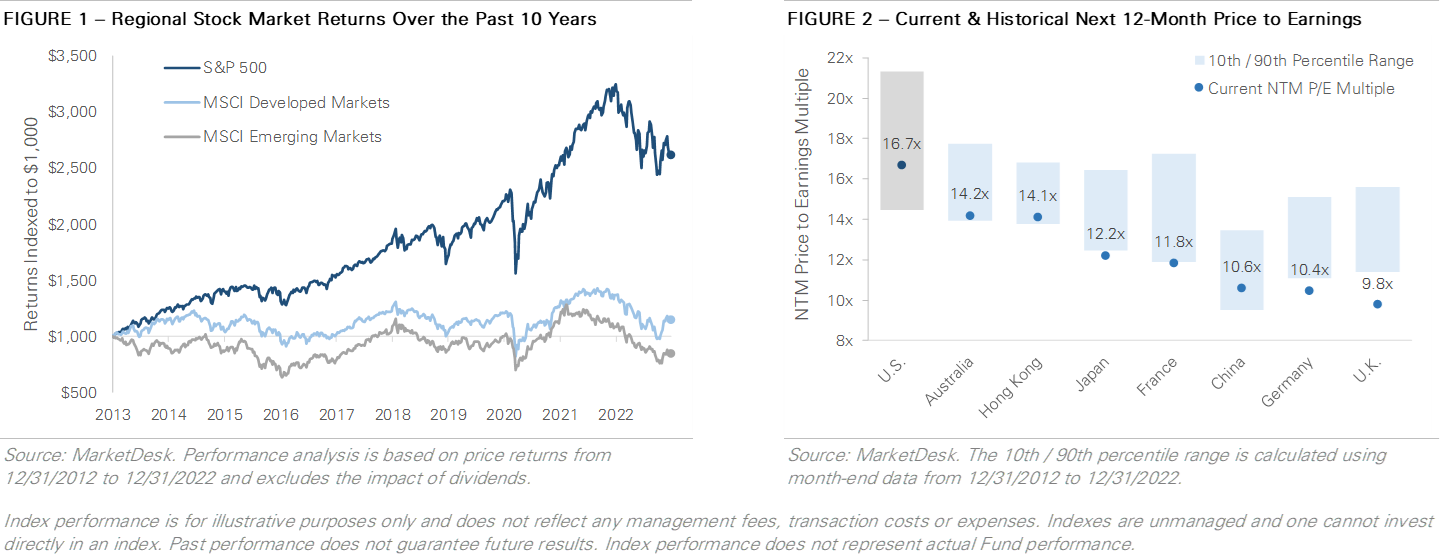
Is International Finally Ready to Shine?
Today international stocks currently trade at more attractive valuations than U.S. stocks after a decade of underperformance. U.S. stocks trade at a higher next 12-month price-to-earnings multiple than international stocks. In addition, U.S. stocks trade more expensive against their historical valuation range, as evidenced by the 10th to 90th percentile range of historical price-to-earnings multiples.
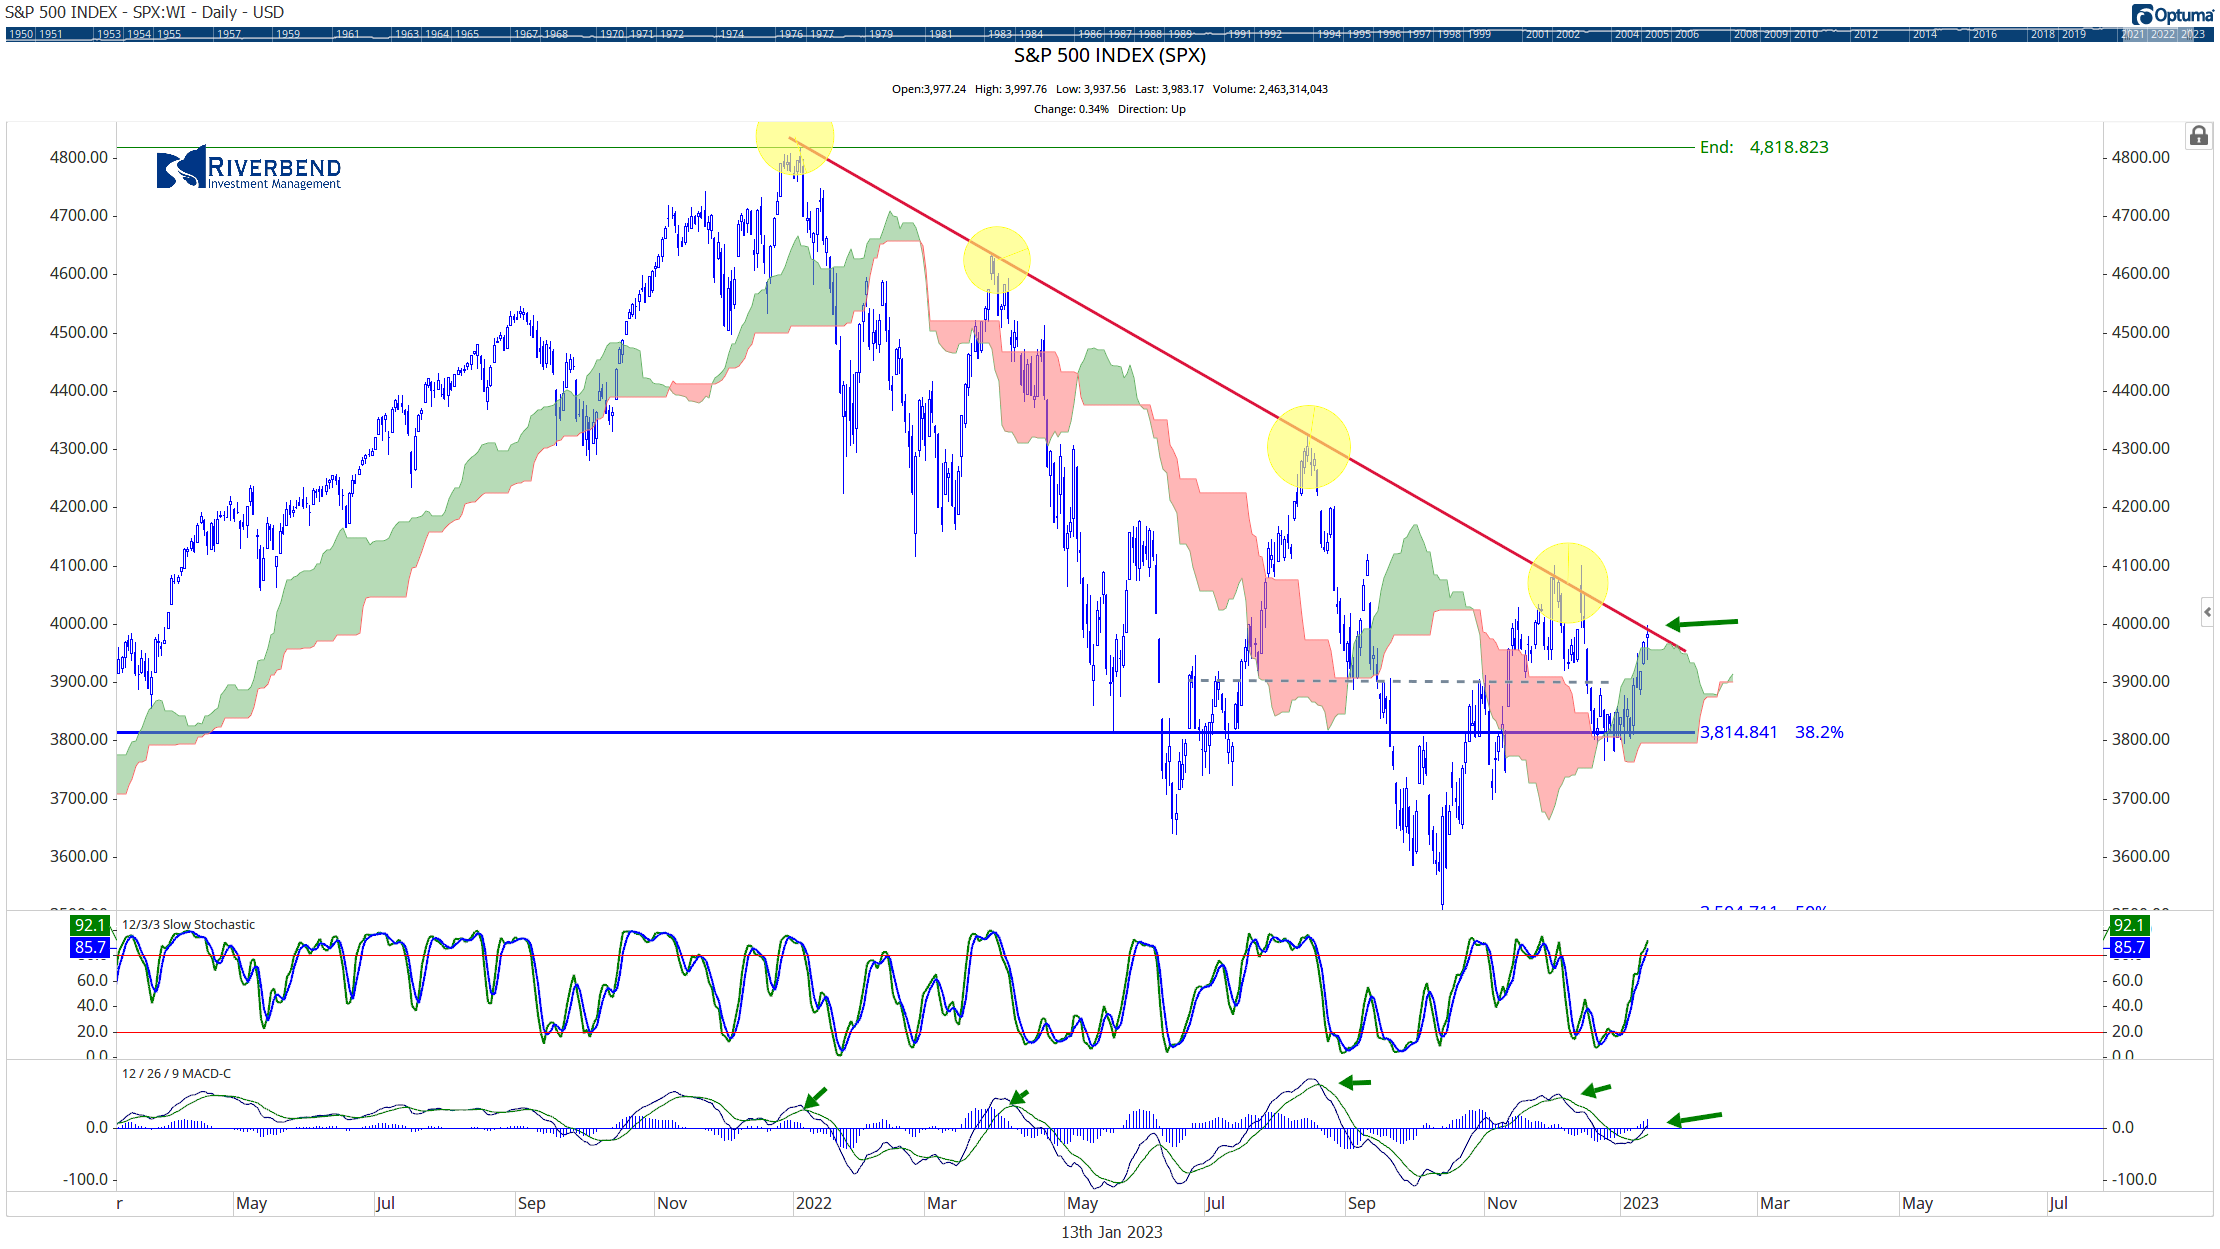
Is This Time Different?
While doing my daily chart review, I noticed an interesting change within the S&P 500 taking place. The S&P 500 is clearly still in a downtrend as marked by the red, downward trend line. But notice the MACD; in the past, the MACD had already formed a buy...
Stocks Trade Higher for a Second Consecutive Month
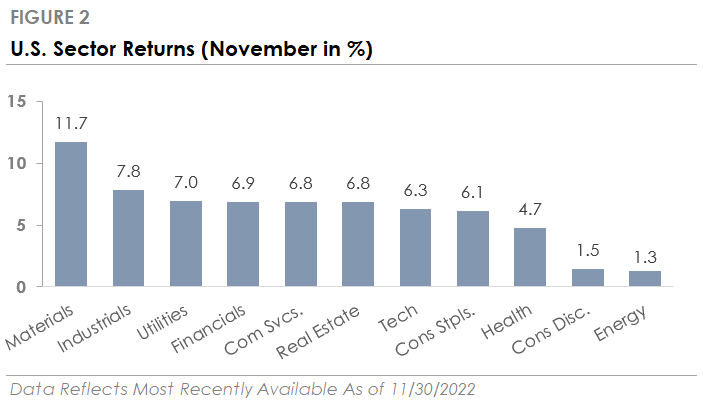
Monthly Market Summary The S&P 500 Index returned +5.6% during November, outperforming the Russell 2000 Index’s +2.2% return. Cyclical sectors outperformed during November, with Materials (+11.7%) and Industrials (+7.8%), the top two sectors. Energy (+1.3%) was...
Global Equity Update – Q4 2022

John Rothe CMT is the Founder and Chief Investment Officer of Riverbend Investment Management